Canadian Dollar, USD/CAD, Bank of Canada, Employment Data – Talking Points:
- Yesterday’s Wall Street sell-off carried over into Asia-Pacific trade, as the ASX 200 plunged over 3%.
- Upcoming Canadian employment data may buoy the local Dollar.
- USD/CAD rates poised to resume downtrend as price staggers at key chart resistance.
Asia-Pacific Recap
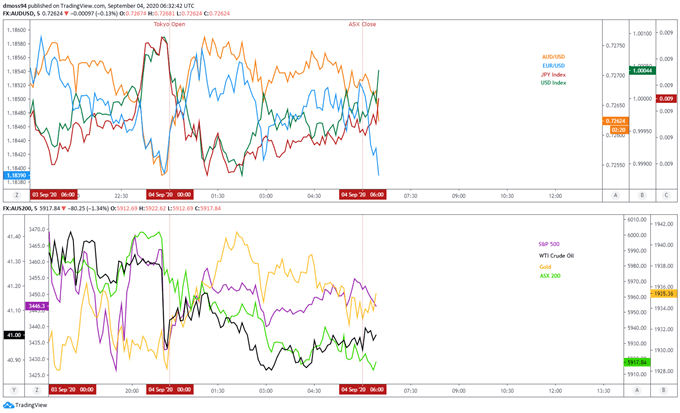
The haven-associated US Dollar and Japanese Yen lost ground early during Asia-Pacific trade before surging into the close of the Australian session, as market participants look ahead to the upcoming US non-farm payrolls report for August.
Equity markets plunged lower, following on from yesterday’s bloodbath as the Australian ASX 200 plunged 3% and S&P500 futures slid another 0.5%.
Gold and silver prices nudged higher while US 10-year Treasury yields held steady.
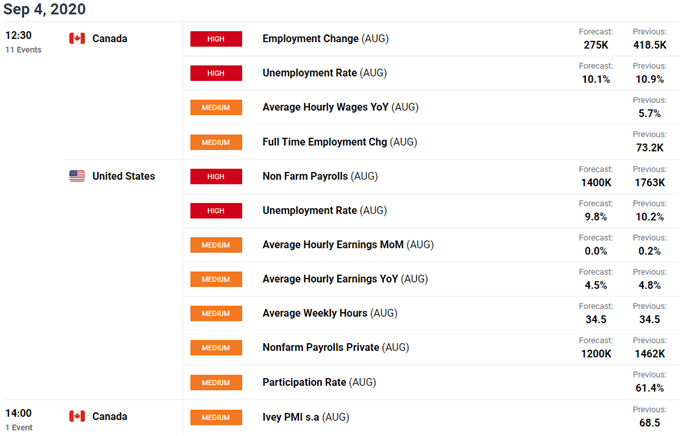
Looking ahead, Euro-area construction PMI could prove market-moving ahead of US and Canadian employment data for August.

Market reaction chart created using TradingView
Employment Data May Ignite USD/CAD Downtrend
Upcoming Canadian and US jobs data for the month of August may weigh on the USD/CAD exchange rate and potentially halt the Greenback’s tentative 4-day recovery against the Loonie.
As noted in previous reports, the Federal Reserve’s ultra-accommodative stance in response to the coronavirus pandemic has been a driving force behind the significant decline seen in USD/CAD rates, with the adoption of average inflation targeting (AIT) potentially exacerbating USD selling in the coming months.
However, recent statements from several members of the Bank of Canada suggesting that monetary policy may be at its effective limit, could also intensify the USD/CAD exchange rate’s decline in the near term.

Deputy Governor Carolyn Wilkins stated that “central banks are likely to run out of conventional firepower if we see an economic downturn in a low-interest-rate world” at the central bank’s Monetary Policy Framework review on August 26.
This was followed up by Governor Tiff Macklem’s statement that “many people don’t feel like inflation is falling when food inflation has been averaging almost 3 percent” at the Federal Reserve’s Jackson Hole symposium.
These quotes could indicate that Canadian policymakers are becoming more sensitive to the potential impact of alternative monetary policy measures and may look to roll back some of the BoC’s existing settings, if upcoming data shows the local economy is continuing to move in the right direction.
Easing Covid-19 Restrictions to Buoy CAD
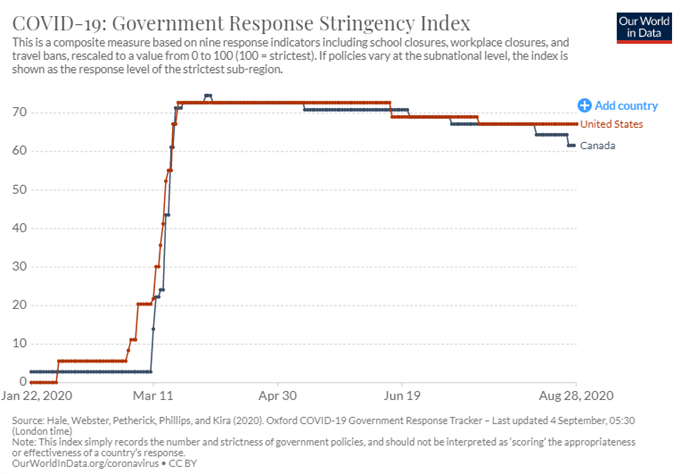
Moreover, the recent easing of lockdown measures in Canada has seen the University of Oxford’s Government Stringency Index dip below the highest level of restrictions currently enforced in the United States.
This progressive loosening of restrictions is likely to foster economic growth and could see the local economy outperform its southern neighbour in the short-term, given the number of Covid-19 cases in the US continue to surge. The 7-day moving average of daily cases hasn’t been below 40,000 since June 28.
To that end, USD/CAD rates may continue to slide lower as the return to normalcy buoys the risk-sensitive Canadian Dollar.

USD/CAD Daily Chart – Schiff Pitchfork Guiding Rates Lower
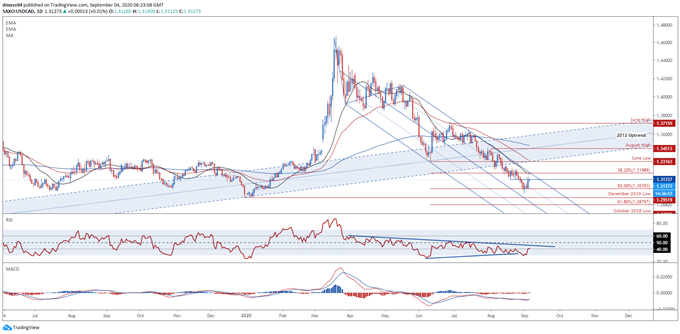
From a technical perspective the path of least resistance for USD/CAD rates remains skewed to the downside as price tracks within the confines of a descending Schiff Pitchfork.
Although RSI has climbed out of oversold territory it has yet to break convincingly above 30 to test the downtrend extending from late March, suggesting that the rally from the monthly low (1.3020) could be running out of steam.
Furthermore, the MACD indicator is still tracking in negative territory despite price climbing back above the psychologically pivotal 1.31 level.
Therefore, further losses appear in the offing if USD/CAD is unable to overcome resistance at the 21-day moving average and 38.2% Fibonacci (1.3199), with a daily close below the 50% Fibonacci probably signalling a resumption of the primary downtrend and carving a path to test the December 2019 low (1.2952).

USD/CAD daily chart created using TradingView
-- Written by Daniel Moss, Analyst for DailyFX
Follow me on Twitter @DanielGMoss

