US Dollar, EUR/USD Price Analysis
- The month of March produced outsized volatility in global markets.
- After setting a fresh yearly low in early-March, the US Dollar jumped up to three-year-highs less than two weeks later.
- As the risk aversion theme has settled over the past couple of weeks, US Dollar price action has calmed. But next week brings on the Fed and ECB and the fear trade may not yet be out of the equation.
US Dollar – From Yearly Lows to Three-Year-Highs as Fear Takes Over
The full-force volatility that was in full display through much of March has started to settle a bit. It’s still far too early to call game over or to claim that we’re yet out of the woods, especially with the fireworks that showed in oil markets earlier this week; and as looked at yesterday, there may be another bearish wave to show in US equities after the month-long bounce found some element of resistance coming into this week’s trade.
In the land of currencies, the US Dollar has similarly seen price action calm in the past couple of weeks as the aggressive risk aversion has toned-down. This follows an outsized show of volatility last month that saw the USD move from a fresh yearly low up to a new three-year-high, a run constituting as much as 8.8% of the US Dollar’s value in a ten-day span. A remarkable move in any number of markets but perhaps even more so when considering that this was taking place in the ‘global reserve currency’ of the US Dollar. At the core of the move was fear-driven risk aversion on the way up and a cessation of those fears on the way back down, helped along by some large stimulus programs out of both the US Treasury and Federal Reserve.
Since then and for much of April trade so far, the US Dollar has been showing some element of mean reversion with a tightening in price action showing over the past week. This sets the stage for what could be a big showing next week as we hear from both the Federal Reserve and the European Central Bank. The March FOMC rate decision was obscured by the mayhem in markets and in response the Fed posed an emergency rate cut over the weekend before that rate decision was scheduled to take place. And while we’ve hear some FOMC commentary from various members over the past few weeks, next Wednesday’s rate decision will be the first such opportunity for the bank to share their contingency plans for whatever lies ahead.
US Dollar Four-Hour Price Chart
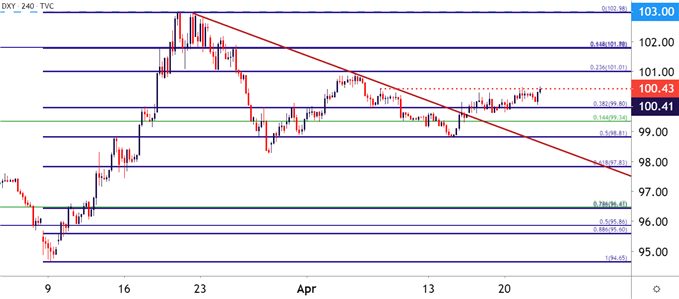
Chart prepared by James Stanley; USD, DXY on Tradingview
The day after, Thursday, April 30th brings the European Central Bank into the spotlight and, similarly, this will be a prime opportunity for the bank to share their plans for how they might react in response to the near-certain downdraft that will likely show in economic data in the weeks and months to come.
For much of March trade, it appeared as though EUR/USD was being driven by flows in the US Dollar. The pair came into the month with strength, soon jumping up to test the resistance zone around the 1.1500 handle. But as the USD-strength theme came rushing into markets, EUR/USD dropped precipitously, soon setting a fresh two-year-low in the pair at the spot of 1.0633. Since then – and mirroring that theme in the US Dollar, the market’s price action has settled a bit. Last week I had looked at resistance potential in the pair as a rising wedge had formed, taking on the tone of a bear flag-type backdrop. And while prices did break-down, sellers were unable to make much ground below the 1.0800 handle, which has since come in as support.
EUR/USD Four-Hour Price Chart
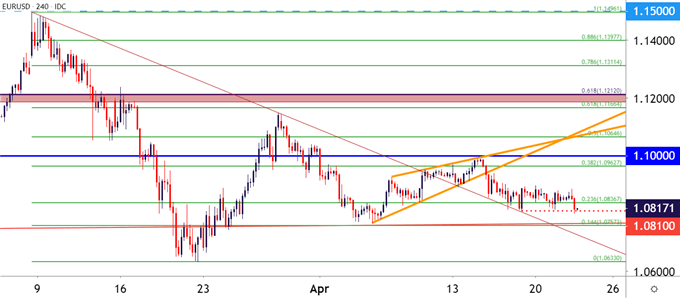
Chart prepared by James Stanley; EURUSD on Tradingview
Taking a step back on EUR/USD, the big question is whether sellers can take control to bring on a test of the batch of support that came into play from March of 2015 into March of 2017. This is the range of support that showed just after the European Central Bank initially entered the stimulus fray; notably, this support is more than 300 pips away from the elusive parity value that was so widely followed during the pair’s bearish run in the second-half of 2014 trade.
This scenario appears to align with the global risk aversion theme, which could be driven by investors driving into the US Dollar as fear takes over, similar to the 3,000+ pip run that showed in the pair during the depths of the Financial Collapse in 2008.
EUR/USD Monthly Price Chart
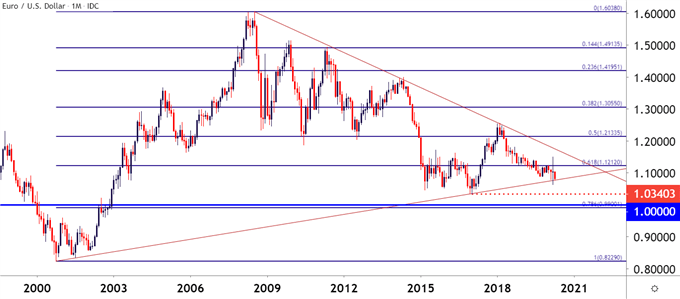
Chart prepared by James Stanley; EURUSD on Tradingview
Going back to the US Dollar and looking at matters with a bigger-picture outlook, and the area of resistance from which the currency turned last month is key. The 103-area in DXY is an area that hasn’t been in-play much in the DXY over the past 17 years, with the notable exception being the post-Election run in 2016, opening into 2017; after which the currency turned and began to sell-off for much of the next year. DXY finally found support around the 50% marker of the 2011-2017 major move.
At this point, the potential exists for a contentious test of this longer-term area of resistance in the US Dollar. Should risk aversion come back with force, the possibility exists for a breakout up to fresh 17-year highs as investors rush for safety in the US Dollar.
US Dollar Monthly Price Chart
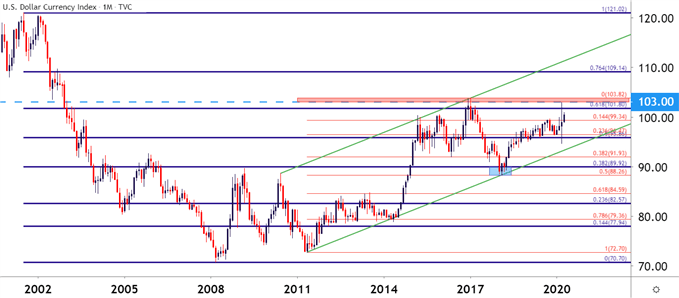
Chart prepared by James Stanley; USD, DXY on Tradingview
--- Written by James Stanley, Strategist for DailyFX.com
Contact and follow James on Twitter: @JStanleyFX


