US Dollar Index, Federal Reserve, Volatility Index, TED Spread – Talking Points:
- The Australian ASX 200 index surged 2.42% during Asia-Pacific trade as investor’s priced in a 15bps cut from the RBA at its upcoming meeting on October 6
- Federal Reserve Chair Jerome Powell’s testimony before the House Financial Services Committee failed to cap the Greenback’s recent surge.
- US Dollar index could continue to push higher after validating an Inverse Head and Shoulders pattern.
Asia-Pacific Recap
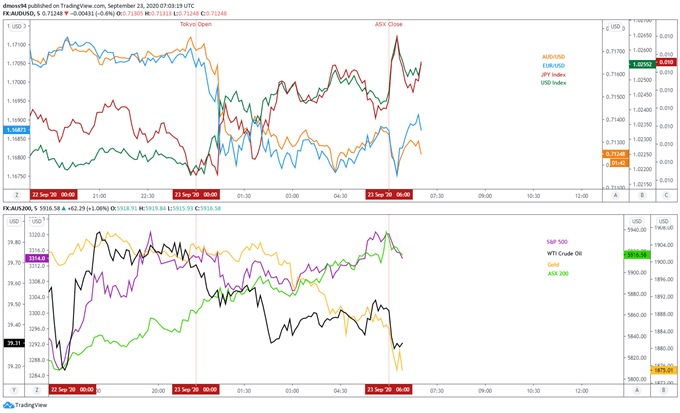
The haven-associated US Dollar and Japanese Yen continued to climb higher against their major counterparts, as the market digested Federal Reserve Chair Jerome Powell’s testimony before the House Financial Services Committee.
The Australian benchmark ASX 200 index surged 2.42% as investor’s priced in a 15 basis-point cut from the Reserve Bank of Australia at its October 6 meeting.
Gold and silver continued to slide lower as US 10-year Treasury yields drifted back below 67 basis points.
Looking ahead, US manufacturing PMI figures for September headline the upcoming economic docket.

Market reaction chart created using TradingView
USD Unfazed by Powell Testimony, Haven Flows Underpinning the Greenback
Federal Reserve Chair Jerome Powell and Treasury Secretary Steve Mnuchin’s comments before the House Financial Services Committee failed to halt the US Dollar’s burst above key chart resistance, as the reimposition of coronavirus-enforced restrictions in several European nations notably soured investor’s sentiment.
However, with Powell reconfirming the central bank’s commitment to “using our tools to do what we can, for as long as it takes, to ensure that the recovery will be as strong as possible, and to limit lasting damage to the economy”, there is a distinct possibility that the Greenback’s 2.73% surge from the yearly low may prove to be a counter-trend correction.
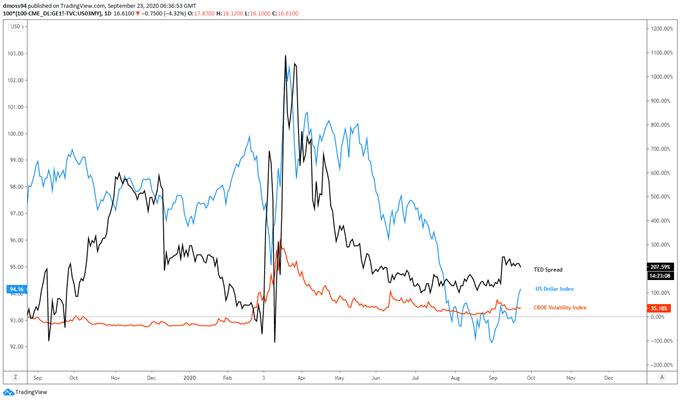
In fact, the US Dollar’s recent spike to its highest levels since late July failed to coincide with a notable rise in volatility or a marked deterioration in credit market conditions. The CBOE Volatility Index (VIX) is currently hovering below 30, while the TED spread – a measure of perceived risk in the financial system – remains below the levels seen in late May.
Therefore, the Greenback’s surge to fresh monthly highs may end abruptly in the coming days, if the relatively bleak fundamental outlook fails to impact credit market conditions.

TED Spread, Volatility Index and US Dollar Index daily chart created using TradingView
US Dollar Index Daily Chart – Inverse Head and Shoulders Could Inspire USD Bulls
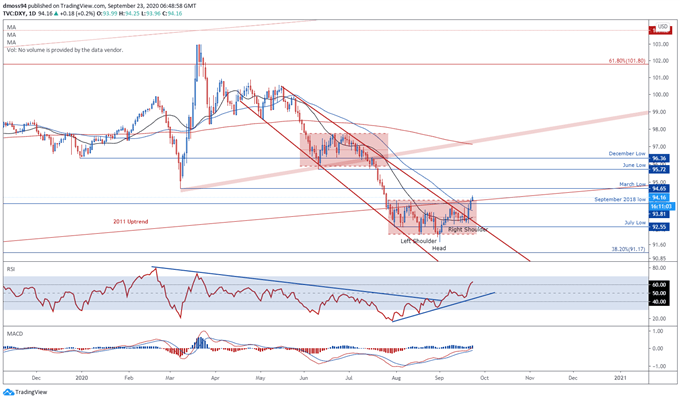
From a technical perspective, the haven-associated US Dollar looks poised to push back towards the June low (95.72), after price successfully broke above the neckline of a bullish Inverse Head and Shoulders pattern carved out just above key psychologically support at the 92.00 mark.
That being said, the notable flattening out of the RSI prior to entering into overbought territory hints at fading bullish momentum, and with the MACD indicator continuing to track below its neutral midpoint, the path of least resistance for the Greenback seems skewed to the downside.
Nevertheless, if price remains constructively perched above key support at the August high (93.99) a test of the March low (94.65) looks more than likely, with the implied measured move of the Inverse Head and Shoulders pattern implying price could climb a further 2.35% from current levels to test the December low (96.36).
Conversely, a daily close back below the 94.00 level could inspire would-be sellers, with a break below the September 2018 low (93.81) probably signalling the resumption of the primary uptrend and open a path for USD to retest the yearly low (91.75).

US Dollar Index daily chart created using TradingView
-- Written by Daniel Moss, Analyst for DailyFX
Follow me on Twitter @DanielGMoss

