US Dollar Talking Points:
- A back-loaded economic calendar may run into holiday-thin liquidity ahead of the July 4th holiday in the United States.
- The US Dollar has held near a key zone following the FOMC-fueled breakout two weeks ago.
- EUR/USD may hold some attraction for USD-bulls, as the pair has held resistance at a big spot on the chart.
- The analysis contained in article relies on price action and chart formations. To learn more about price action or chart patterns, check out our DailyFX Education section.
The final three days of last week turned out to be very quiet in the US Dollar, with each day’s candle showing some element of indecision. A Wednesday spinning top led into two consecutive dojis, and this highlights how there’s some element of equilibrium with the current USD spot rate. But – this doesn’t mean that it’ll stay that way for long, as holiday thin conditions will likely show in the latter portion of this week and that’s when two really big US data releases come out.
High-Impact Data Ahead of July 4th Holiday

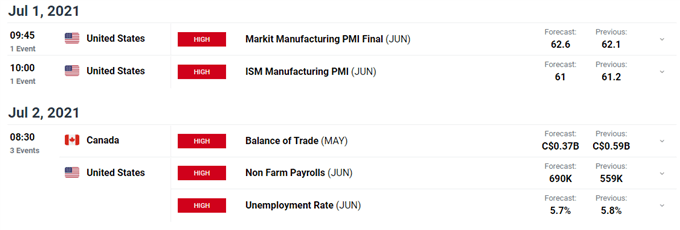
Taken from DailyFX Economic Calendar
Thursday brings PMI and Friday brings Non-farm Payrolls, and after the FOMC rate decision a couple of weeks ago, fully expect intense focus to be paid to both reports. NFP, in particular, should be notable as this will be the first look that markets get at employment and wage inflation for the month of June. Expectations for new jobs are high, with the expectation for +690k jobs to have been added during the month of March, a jump from the +559 that had printed in early-June for the month of May.
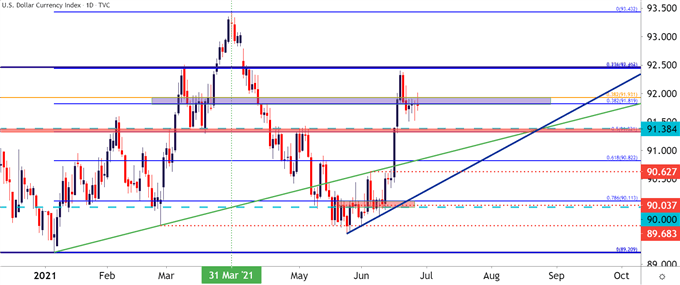
In the US Dollar, prices have held around the big zone that was noted last Tuesday, showing between two Fibonacci levels at 91.82 and 91.93. After a brief spot of support early last week, this zone soon became resistance and helped to hold the highs through last week’s close. And, so far this week, we’re seeing even more indecision in today’s non-completed candle.
To learn more about Fibonacci, check out DailyFX Education
US Dollar Daily Price Chart

Chart prepared by James Stanley; USD, DXY on Tradingview
EUR/USD in Resistance Zone
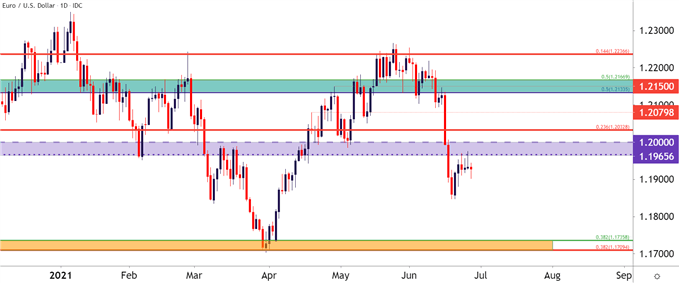
For USD-strength strategies, EUR/USD may hold some interest. I had looked into the matter just after the FOMC rate decision, highlighting a big zone of resistance in EUR/USD that could open the door for bearish trend scenarios. That zone runs from 1.1965-1.2000, and last week, this held the highs on Wednesday and Friday. So far this week, sellers pushed down to a near-term lower-low, highlighting the bearish potential that may be brewing in EUR/USD, particularly if USD bulls prevail around this week’s drivers of PMI and NFP.
EUR/USD Daily Price Chart

Chart prepared by James Stanley; EURUSD on Tradingview
--- Written by James Stanley, Senior Strategist for DailyFX.com
Contact and follow James on Twitter: @JStanleyFX

