US Dollar, USD/CAD, Non-Farm Payrolls, Inflation, 10-Year Breakevens – Talking Points:
- Equity markets gained ground during APAC trade as investors cheered the continued decline in global coronavirus infections.
- USD may extend recent gains as inflationary pressure fuel Fed tapering bets.
- USD/CAD poised to push higher after clearing key technical resistance.
Asia-Pacific Recap
Equity markets pushed higher during Asia-Pacific trade on the back of a continued decline in global coronavirus cases and positive employment data out of the US. Australia’s ASX 200 rose 1.07% despite retail sales falling 4.1% in December, while Japan’s Nikkei 225 surged 1.36%.
In FX markets, USD, JPY, GBP and CHF largely outperformed, while the cyclically-sensitive AUD, NZD and NOK slipped lower. Gold and silver prices crept marginally higher as yields on US 10-year Treasuries held relatively steady. Looking ahead, the US non-farm payrolls report for January headlines the economic docket alongside Canadian jobs data.
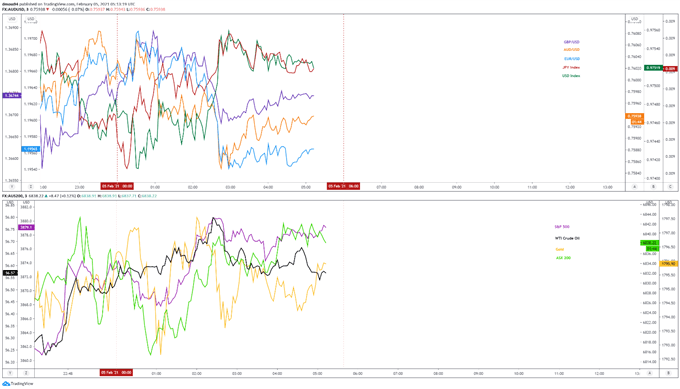
Market reaction chart created using Tradingview
Intensifying Signs of Inflation to Buoy USD
The US Dollar may continue to gain ground against its major counterparts in the near term, as a noticeable pickup in inflation fuels bets that the Federal Reserve may tighten its monetary policy levers sooner than expected.
The Fed’s preferred measure of consumer price growth – the Core Personal Consumption Expenditure (PCE) index – climbed 1.5%YoY in December, exceeding market estimates of a 1.3% print. The ISM manufacturing prices sub-index also surged unexpectedly, rising to 82.1 in January and smashing forecasts for a more conservative increase to 77.
Indeed, inflationary pressures may continue to build in the coming weeks, as Democrats pave the way for President Joe Biden to pass the majority of his proposed $1.9 trillion stimulus package with a simple majority.
10-Year Breakeven Inflation Rate
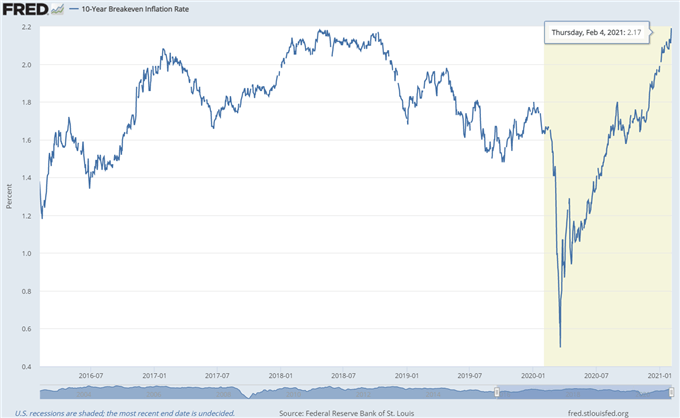
Source - FRED
Positive vaccination progress and falling coronavirus cases may also foster further consumer price growth. The 7-day moving average tracking Covid-19 infections has declined by over 130,000 in the last three weeks, while over 33 million Americans have received at least one dose of a coronavirus vaccine.
However, it still seems relatively unlikely that the Fed will look to adjust its monetary policy settings anytime soon, after the central bank reiterated its pledge to continuing increasing “its holdings of Treasury securities by at least $80 billion per month and of agency mortgage-backed securities by at least $40 billion per month until substantial progress has been made toward the Committee’s maximum employment and price stability goals”.
Several Fed members have also talked down the idea of tapering bond purchases anytime soon, with Chairman Jerome Powell stating that “the whole focus on exit is premature” and St Louis Fed President James Bullard commenting that “we are still in the middle of a crisis, so it’s too early to initiate that discussion”.
Nevertheless, a larger-than-expected rise in average hourly earnings could intensify tapering bets in the near term and open the door for the US Dollar to extend its recent gains.
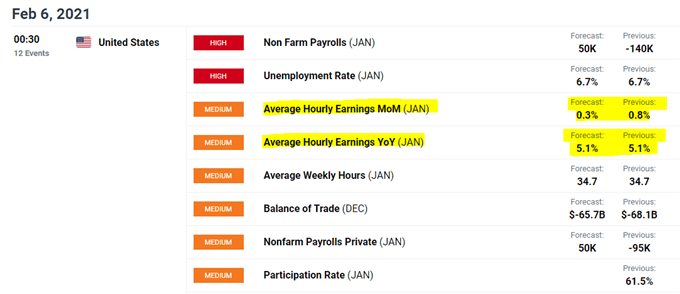
DailyFX Economic Calendar
USD/CAD Daily Chart – Eyeing Descending Channel Resistance
From a technical perspective, the US Dollar looks poised to continue gaining ground against its Canadian counterpart, as USD/CAD remains burst above the trend-defining 50-day moving average and psychological resistance at 1.2800.
With the RSI snapping the downtrend extending from the March extremes, and the MACD climbing to its highest levels since November, the path of least resistance seems skewed to the upside.
A daily close above the January high (1.2881) would likely open the door for price to probe the 38.2% Fibonacci (1.2929). Hurdling that brings Descending Channel resistance and the 100-DMA (1.2983) into the crosshairs.
However, if price slips back below former support-turned-resistance at the January 4 high (1.2798) sellers could drive the exchange rate back towards the yearly low (1.2589).
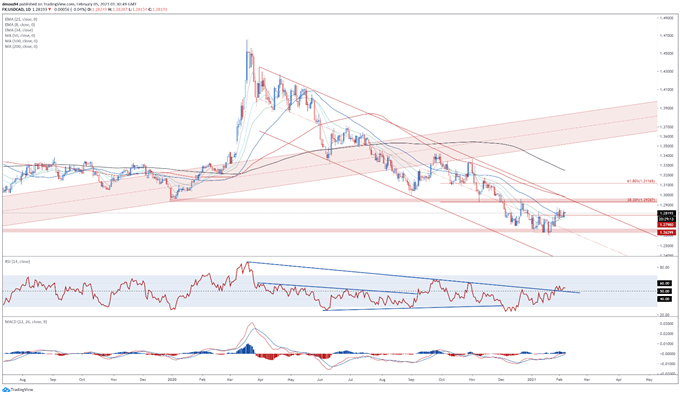
USD/CAD daily chart created using Tradingview
USD/CAD 4-Hour Chart – Symmetrical Triangle Hints at Further Gains
Zooming into a four-hour chart bolsters the bullish outlook depicted on the daily timeframe, as USD/CAD carves out a Symmetrical Triangle above key range support at 1.2760 – 1.2790.
A convincing burst above 1.2850 would probably validate the continuation pattern and propel prices towards the psychologically imposing 1.2900 mark, with the pattern’s implied measured move suggesting price could climb to challenge the 1.3000 level.
Conversely, a pullback towards the sentiment-defining 200-MA (1.2816) could be on the cards if buyers fail to breach triangle resistance.
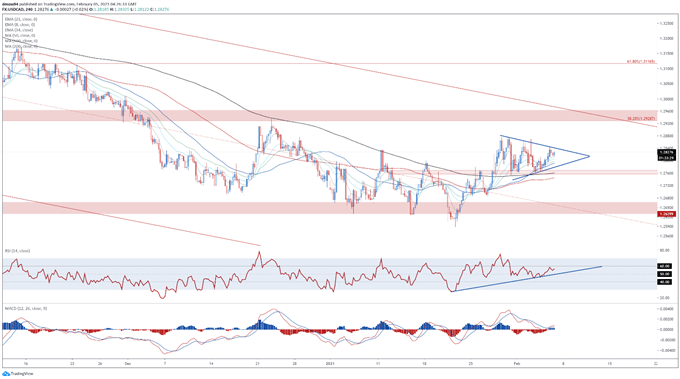
USD/CAD 4-hour chart created using Tradingview
IG Client Sentiment Report
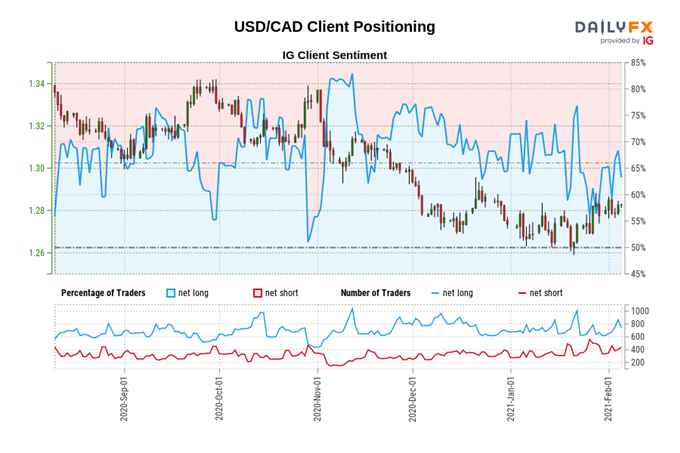
The IG Client Sentiment Report shows 63.43% of traders are net-long with the ratio of traders long to short at 1.73 to 1. The number of traders net-long is 14.38% lower than yesterday and 7.98% higher from last week, while the number of traders net-short is 8.06% higher than yesterday and 3.38% lower from last week.
We typically take a contrarian view to crowd sentiment, and the fact traders are net-long suggests USD/CAD prices may continue to fall.
Positioning is less net-long than yesterday but more net-long from last week. The combination of current sentiment and recent changes gives us a further mixed USD/CAD trading bias.
-- Written by Daniel Moss, Analyst for DailyFX
Follow me on Twitter @DanielGMoss


