US Dollar Price Forecast:
- The September FOMC rate decision looms ahead, and the US Dollar has built into a descending triangle ahead of the Fed.
- The US Dollar ran into a big area of support in early-September, and that helped to turn the tide on the sell-off that had dominated the market since mid-March.
- The descending triangle will often be approached with the aim of bearish drives, looking for the same motivation that’s produced lower-highs to eventually allow for a breach of horizontal resistance. To learn more about this formation, or other chart patterns, check out DailyFX Education.
USD Support Bounce Meets FOMC
It’s been a riveting year already in the US Dollar and there’s still a little more than a full quarter to go before we can all put 2020 behind us. Along the way will be a highly-contentious Presidential Election as a global pandemic rages in the background; so it’s likely that volatility is here to stay for a bit.
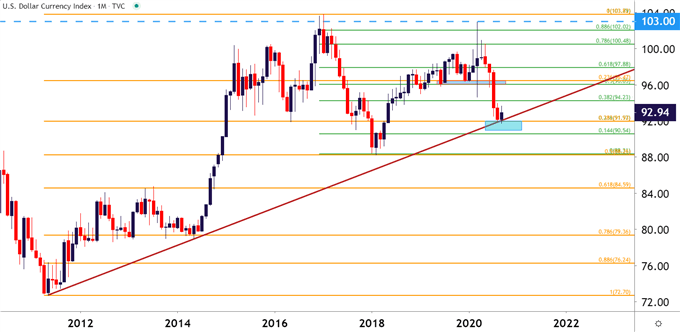
In the US Dollar, this year’s theatrics have led to a net-bearish outlay, although that didn’t happen in a straight line as the initial move when the coronavirus began to get priced-in was an aggressive bout of strength. That strength lasted for about the first two weeks of March, at which point the USD tested the 103.00 level in DXY and soon reversed off of those highs.
The next six months would largely be filled with pain for USD-bulls as the currency was mired in a series of downtrends. This eventually broke down to a huge area on the chart that started to come into play in late-August. This confluent support zone offered a couple of different Fibonacci retracements along with a trendline that can be found by connecting 2011 and 2014 swing lows.
That support has since helped to hold the lows, and the first-half of September has even seen an initial push up to higher-highs and possibly even higher-lows.
US Dollar Monthly Price Chart

Chart prepared by James Stanley; USD, DXY on Tradingview
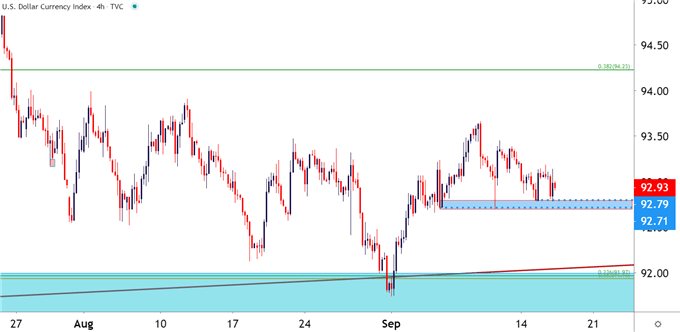
That initial incursion upon support shoed around the September open, and that led into a strong burst-higher as the USD bucked up to a fresh short-term higher-high. But, over the past week, that bullish move has largely fallen flat and price action in the Greenback has tip-toed down to a zone of increasingly familiar support running from around 92.70-92.80 on DXY.
US Dollar Four-Hour Price Chart

Chart prepared by James Stanley; USD, DXY on Tradingview
US Dollar: Short-Term Descending Triangle, Long-Term Support
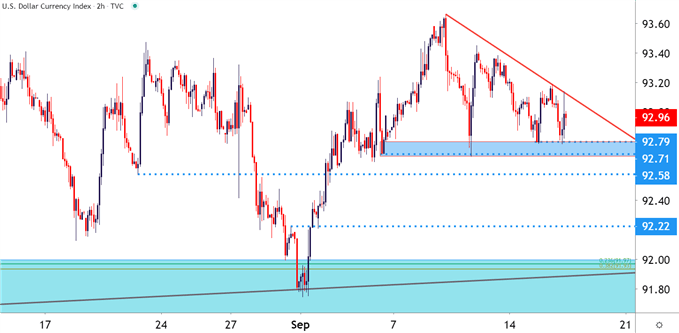
At this point, with the September FOMC rate decision looming just ahead on the economic calendar, the US currency has built into a bearish formation as shown in a descending triangle. The descending triangle is marked by horizontal support along with a series of lower-highs, highlighting the potential for consistent selling pressure as shown by those lower highs to, eventually, allow for a breach of horizontal support.
But in this scenario around the USD, the longer-term matter of that big picture support looked at earlier remains an issue. So if the USD does kick off a bearish move around FOMC or in the near-term, the big question is whether sellers can push below 92.00 on DXY to craft a fresh low: And if not, then the backdrop for bullish reversal potential may remain as the door begins to close on Q3 and attention shifts to the final quarter of this year.
US Dollar Two Hour Price Chart

Chart prepared by James Stanley; USD, DXY on Tradingview
--- Written by James Stanley, Strategist for DailyFX.com
Contact and follow James on Twitter: @JStanleyFX

