US Dollar, DXY, Non-Farm Payrolls, ISM PMIs, Sell-In May – Talking Points:
- The haven-associated US Dollar may continue to gain ground on seasonal dynamics and robust economic data.
- Bullish Falling Wedge break hints at further gains for the US Dollar Index (DXY).
Asia-Pacific Recap
Equity markets slipped lower during Asia-Pacific trade, as inflation concerns and geopolitical tensions weighed on market sentiment. Australia’s ASX 200 held relatively steady on the day despite news that the nation is reviewing Chinese ownership of a major port in the Northern Territory. Japan’s Nikkei 225 (-0.83%), Hong Kong’s Hang Seng Index (-1.51%), and China’s CSI 300 (-0.79%) all lost ground.
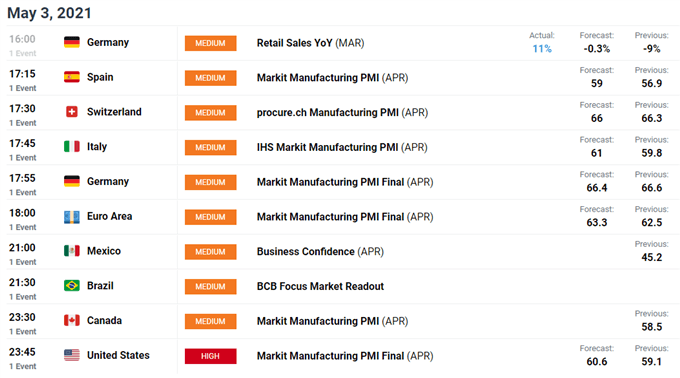
In FX markets, the cyclically-sensitive AUD and NZD outperformed their major counterparts, while CAD and JPY came under pressure. Gold prices jumped just over 0.5% per troy ounce, as yields on US 10-year Treasuries slid 1 basis point lower. Looking ahead, a slew of PMI figures out of Europe and the US headline the economic docket.

Sell-in May Seasonal Dynamics to Underpin DXY
The US Dollar may continue to climb higher in the coming weeks, on the back of robust jobs figures and seasonal dynamics. The upcoming non-farm payrolls report could intensify Federal Reserve tapering bets, which appear to have been re-invigorated by a larger-than-expected Q1 GDP print.
The local economy is expected to add in excess of a million jobs in April, building on a 916,000 increase in payrolls in March. ISM PMI figures are also forecast to be robust, with the manufacturing sector penned to record its largest expansion in 37 years, while the services sector is estimated to expand at the fastest pace on record.
Seasonal dynamics may also buoy the haven-associated Greenback in the near term, as the adage “sell-in May and go away” begins to ring in market participants ears. With that in mind, a more extensive corrective rally could be on the table for the US Dollar, if market sentiment sours in the week ahead.
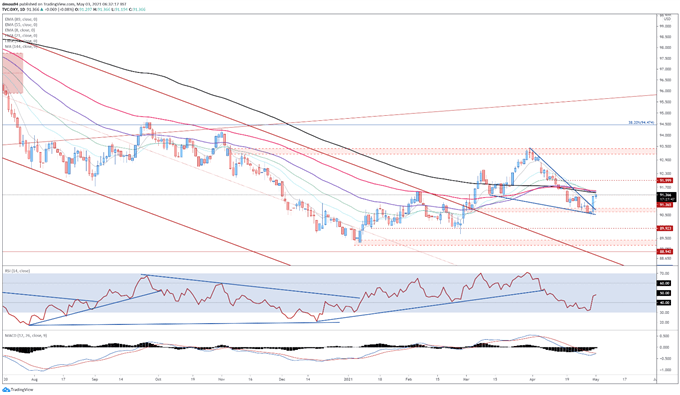
US Dollar Index (DXY) Daily Chart – Falling Wedge Break to Trigger Further Upside

Chart prepared by Daniel Moss, created with Tradingview
From a technical perspective, the US Dollar Index (DXY) looks poised to extend recent gains, after the formation of a Bullish Engulfing candle validated the topside break of a bullish Falling Wedge pattern.
With a bullish crossover on the MACD indicator in play, and the RSI eyeing a push above its neutral midpoint, the path of least resistance seems higher.
A daily close above the 89-EMA (91.56) probably validates bullish potential and opens the door for buyers to drive the index back towards range resistance at 93.20 – 93.40.
However, if 91.50 successfully neutralizes buying pressure, a pullback to range support at 90.60 – 90.70 could be in the offing.
-- Written by Daniel Moss, Analyst for DailyFX
Follow me on Twitter @DanielGMoss


