US Dollar Index, DXY, FOMC, US Q1 GDP, US 10-Year Treasury Yields – Talking Points:
- Equity markets lost ground during APAC trade as investors look towards a series of US corporate earnings releases.
- The FOMC’s dovish stance may limit the US Dollar’s upside against its major counterparts.
- US Dollar Index (DXY) poised to slide lower as prices challenge key range support.
The Quiz
Discover what kind of forex trader you are
Asia-Pacific Recap
Equity markets slid lower during Asia-Pacific trade ahead of a slew of significant corporate earnings releases out of the US and the upcoming FOMC interest rate decision. Australia’s ASX 200 (-0.21%), China’s CSI 300 (-0.82%) and Hong Kong’s Hang Seng Index (-0.22%) all lost ground, while Japan’s Nikkei 225 crept marginally higher.
In FX markets, the cyclically-sensitive AUD and NOK largely outperformed alongside GBP, while the haven-linked USD, CHF and JPY fell against their major counterparts. Gold price drifted lower for the third consecutive day as yields on US 10-year Treasuries rose just under 2 basis points.
Looking ahead, US durable goods orders for March highlight the upcoming economic docket, alongside the release of Tesla’s much-anticipated earnings.

Dovish FOMC to Keep US Dollar in Check
The US Dollar looks set to continue drifting lower in the week ahead, as investors turn their attention to the upcoming Federal Open Market Committee’s monetary policy meeting on Thursday.
Policymakers are unlikely to signal any changes to the central bank’s monetary policy stance and are expected to reiterate that there will be no tapering of measures until there is “substantial further progress” towards its mandated employment and inflation goals.
That being said, an extremely strong Q1 GDP print could push longer-term nominal yields higher in the near term, and underpin the Greenback against its major counterparts.
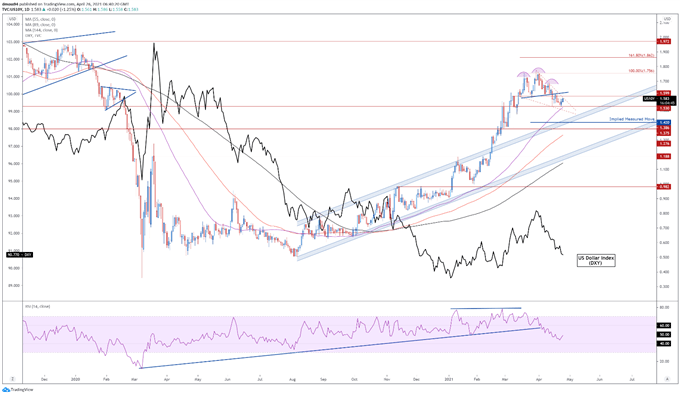
US 10-Year Treasury Yields with DXY Overlay

Chart prepared by Daniel Moss, created with Tradingview
However, with rates markets winding back bets that the Fed will lift from the effective lower bound in 2022, it seems relatively unlikely that a stale data release will shift the needle and trigger a marked sell-off in Treasury markets.
With that in mind, the haven-associated US Dollar may continue to head south in the coming days, outside of a shift in market sentiment towards a risk-off environment.
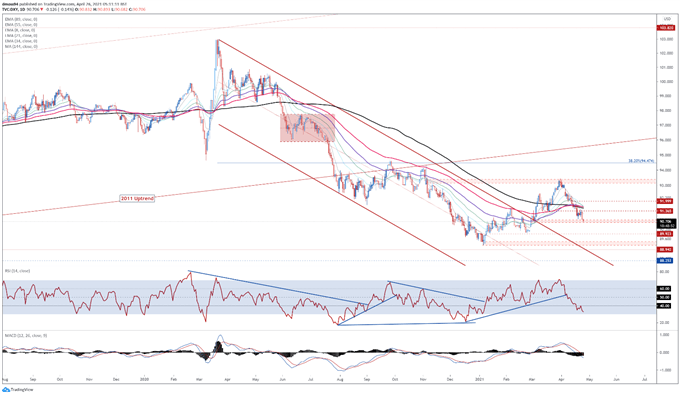
US Dollar Index (DXY) Daily Chart – RSI Hints at Building Bearish Momentum

Chart prepared by Daniel Moss, created with Tradingview
From a technical perspective, the US Dollar looks set to continue sinking lower against its major counterparts in the near term, as the DXY snaps back below all six moving averages and slices through key psychological support at 91.00.
With the RSI diving below 40 for the first time since January, and the MACD sliding into negative territory, the path of least resistance seems skewed to the downside.
A daily close below range support at 90.63 – 90.79 would probably intensify selling pressure and carve a path to challenge the yearly low (89.21).
However, if that stays intact a rebound back towards sentiment-defining 144-MA (91.55) could be on the cards.
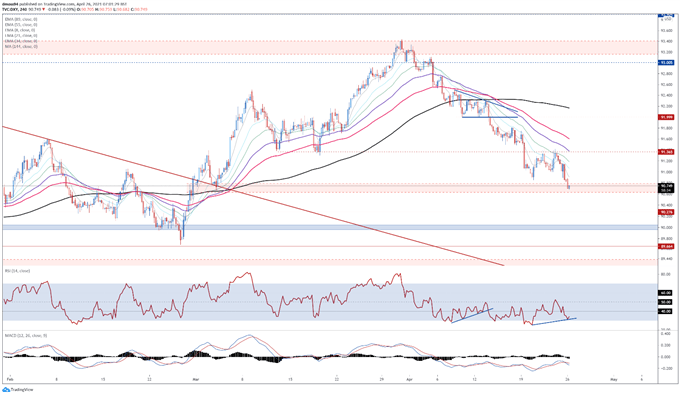
US Dollar Index (DXY) 4-Hour Chart – Bullish RSI Divergence Could Inspire Rebound

Chart prepared by Daniel Moss, created with Tradingview
Bullish RSI divergence on a 4-hour chart however, suggests that a short-term rebound could be on the cards.
Indeed, if prices fail to successfully hurdle 90.60, a topside push to retest the 8-EMA (90.90) may eventuate. Clearing that likely brings the trend-defining 55-EMA (91.38) into focus.
That being said, selling pressure would probably intensify quite significantly if support gives way, with the 90.00 handle highlighted as the next key area of support.
-- Written by Daniel Moss, Analyst for DailyFX
Follow me on Twitter @DanielGMoss

