US Dollar, EUR/USD, GBP/USD, USD/CAD Talking Points:
- USD weakness has continued, and this morning saw the US Dollar punch down to a fresh four-month-low.
- The USD came back after some comments from Richard Clarida highlighted how surprised the Fed Vice Chair was by the earlier month 4.2% CPI print. While last week’s FOMC minutes showed that the Fed still considers inflation as transitory, Mr. Clarida’s more recent comments today indicate that the CPI print was outside of their range of expectations.
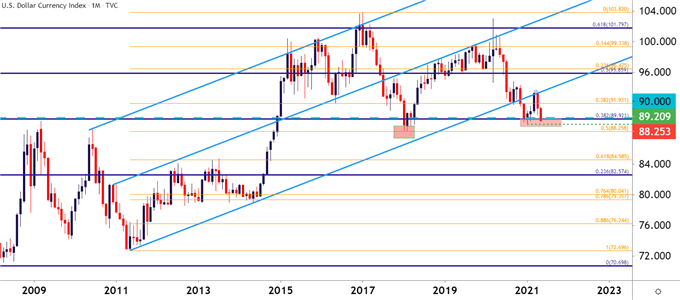
The US Dollar has continued its downtrend, setting a fresh four-month low this morning. Now, only the January swing low around 89.20 stands in the way from fresh multi-year lows. Below 89.20, the 88.25 level stands out as a major point of emphasis, as this caught the 2018 low and is also a Fibonacci level of note.
This afternoon’s driver appeared to emanate from the Fed’s Vice Chair, Richard Clarida, who expressed surprise at the earlier-month inflation print. This brings to question whether the bank still thinks inflation is transitory and, if its not, what might they do about it? This also puts heavier emphasis on the Friday release of PCE data, as this is the Fed’s preferred inflation gauge.
This can open the door for pullback potential in the USD after this morning’s fresh low. The current area of support is a huge one, as seen on the below monthly chart, and it may require a bit more motive before bears are able to leave this behind.
US Dollar Monthly Price Chart

Chart prepared by James Stanley; USD, DXY on Tradingview
EUR/USD Range Breaks
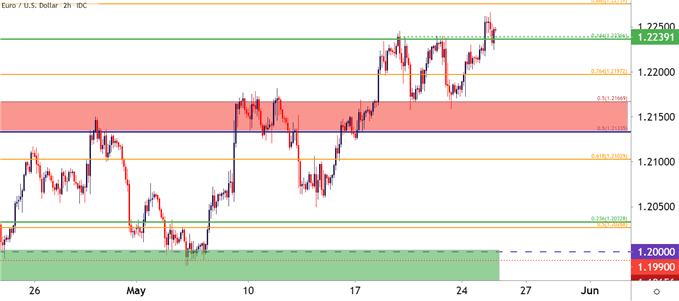
Over the past week, EUR/USD built into a rather consistent range between a couple of very visible Fibonacci levels. This morning’s initial move of USD-weakness helped the pair to break out to fresh four-month-highs; but the Clarida comments helped to bring a pullback.
At this point, there’s bullish trend potential and this may be one of the more attractive bearish USD-looks.
EUR/USD Two-Hour Price Chart

Chart prepared by James Stanley; EURUSD on Tradingview
GBP/USD: Cable Falls from Trendline Underside Resistance
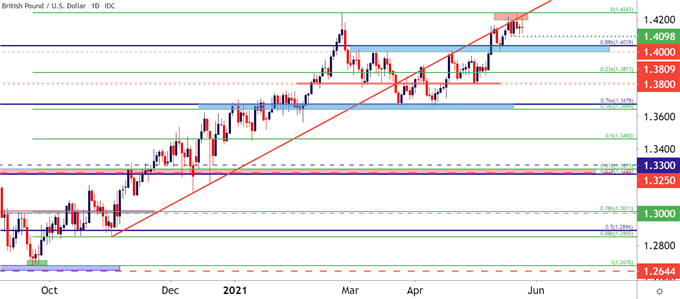
In GBP/USD, bulls have been at work over the past couple of weeks. The pair pushed up towards a fresh three-year-high last week. But bulls were mere pips away from the February high and unable to take that out.
A bit of resistance showed from a familiar area, taken from the bullish trendline connecting November and December lows. That projection has been showing resistance for the past week and change. The trend remains bullish, however, and on the webinar, I looked at a couple of spots to watch for support potential.
GBP/USD Daily Price Chart

Chart prepared by James Stanley; GBPUSD on Tradingview
USD/CAD Deep Oversold
I’ve been a fan of bearish USD/CAD for USD-weakness scenarios, brought upon by the Bank of Canada becoming one of the first central banks to begin looking at post-pandemic policy.
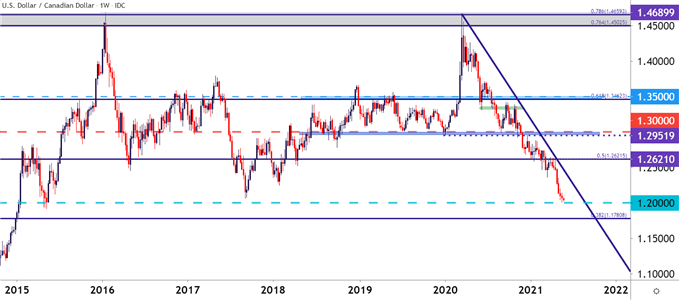
Since that announcement, CAD-strength has been a rather loud theme and, when meshed up with USD-weakness, USD/CAD has been near-vertical.
The pair has already set fresh six-year-lows. But sellers dried up before a test of the 1.2000 handle could come into play, and as I looked into yesterday, the pair may be prime for a pullback in the near-term given how oversold it is, and combined with the major area of long-term support in USD looked at above.
USD/CAD Weekly Price Chart

Chart prepared by James Stanley; USDCAD on Tradingview
--- Written by James Stanley, Senior Strategist for DailyFX.com
Contact and follow James on Twitter: @JStanleyFX

