US Dollar Index, Federal Reserve, ECB, FOMC, DXY – Talking Points:
- A broad risk-on tilt was seen during Asia-Pacific trade as the haven-associated Japanese Yen and US Dollar fell against their major counterparts.
- Wait-and-see ECB could underpin the Euro and in turn weigh on the US Dollar Index (DXY).
- DXY carving out bear flag pattern at key support. Are further losses on the cards for the Greenback?
Asia-Pacific Recap
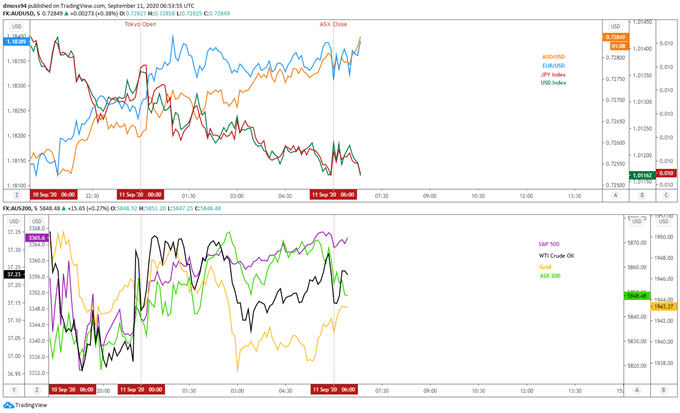
The risk-associated Australian Dollar rose during Asia-Pacific trade while the ‘safe haven’ Japanese Yen and US Dollar slid lower against their major counterparts, despite US policymakers all but ruling out the provision of much needed fiscal stimulus this side of the November elections.
The Australian ASX 200 index lost ground while Japan’s Nikkei 225 index climbed 0.74%.
Gold dipped lower alongside silver as US 10-year Treasury yields fell back below 0.69%.
Looking ahead, US inflation data may prove market-moving as investors’ attention turns to next week’s FOMC interest rate decision.

Market reaction chart created using TradingView
ECB May Ignite DXY Downtrend
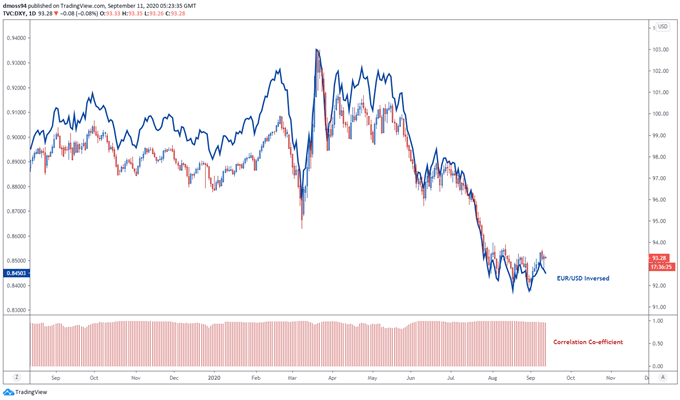
The European Central Bank’s decision to keep its monetary policy levers steady may underpin the Euro in the near-term against the US Dollar and potentially fuel the DXY’s slide back towards its yearly low, given that the Euro accounts for over 57% of the US Dollar Index (DXY).
Although ECB President Christine Lagarde addressed Chief Economist Philip Lane’s concerns about the recent “repricing” of the trading bloc’s currency she shied away from the opportunity to jawbone the EUR/USD exchange rate, stating that “our mandate is price stability and clearly to the extent that the appreciation of the euro exercises a negative pressure on prices, we have to monitor carefully such a matter”.
This suggests that not all Governing Council members are concerned with the Euro’s 12% rise against its US counterpart since late March and despite reconfirming the ECB’s “accommodative monetary policy stance” it appears that additional stimulus measures are off the table in the near term.
US Dollar Index (DXY) vs Inverse EUR/USD

US Dollar Index (DXY) daily chart created using TradingView
However, it remains to be seen if the central bank will maintain the status quo in the coming months, as the “strength of the recovery remains surrounded by significant uncertainty, as it continues to be highly dependent on the future evolution of the pandemic and the success of containment policies”.
Nevertheless, Lagarde’s insistence that “the European Central Bank does not target the exchange rate” will likely buoy the Euro over the coming weeks and could in turn hamper the potential upside for the US Dollar Index.
Congressional Impasse May Force Fed’s Hand
The Federal Open Market Committee (FOMC) meeting on September 16 may also result in a marked discounting of the Greenback against its major counterparts, as the central bank prepares to release the updated Summary of Economic Projections (SEP).
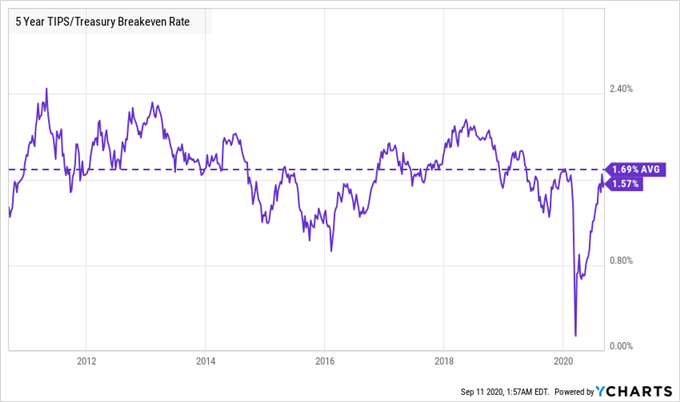
Although the Federal Reserve’s balance sheet has notably stabilized since peaking on June 10 at $7.17 trillion, the adoption of average inflation targeting (AIT) suggests that an expansion of the central bank’s quantitative easing program may be in the offing as 5-year inflation expectations begin to stall just shy of 1.6%.
Given Fed Chair Jerome Powell’s comments that “well-anchored inflation expectations are critical for giving the Fed the latitude to support employment when necessary” it seems relatively unlikely that the central bank will follow in the footsteps of its European counterpart and opt to maintain the status quo.

Moreover, with initial and continuing jobless claims coming in above market forecasts and Congress failing to deliver on much needed fiscal stimulus, market participants may look towards the Fed to pick up the slack in its quest to achieve its “maximum employment and price stability goals”.
Continuing jobless claims for the week ending August 29 increased to 13.38 million, overshooting the expected 13.29 million print, while initial jobless claims held steady at 884,000.
With that in mind, the US Dollar Index may resume its slide from the yearly high set in March, if US policymakers deliver on additional stimulus measures.
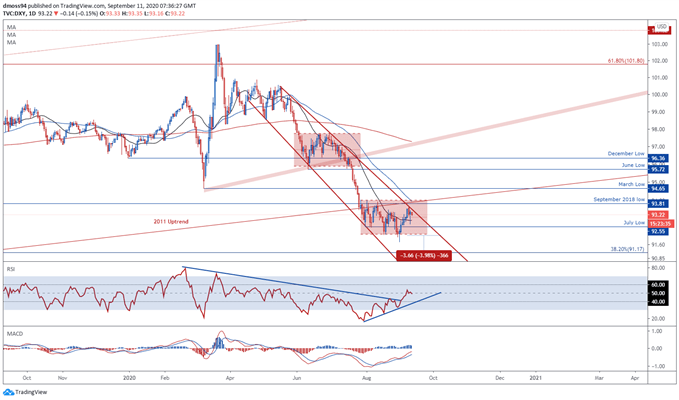
US Dollar Index (DXY) Daily Chart – Bear Flag in Play

US Dollar Index (DXY) daily chart created using TradingView
As noted in previous reports, the US Dollar’s surge to kick off a fresh month of trade may prove to be nothing more than a counter-trend pullback, as price fails to break above Descending Channel resistance and continues to track within a Bear Flag continuation pattern.
Although the RSI and MACD indicators appear to be pointing higher both oscillators remain positioned just below their respective neutral midpoints, which could be indicative of fading bullish momentum.
With that in mind, the Greenback’s 7-day rally may have validated the downside break of the 2011 uptrend and could signal the resumption of the primary downtrend, as price fails to clamber over confluent resistance at the trend-defining 50-day moving average and September 2018 low (93.81).
A daily close back below the 21-DMA (92.89) would probably result in a retest of the August 19 swing-low (92.15), with sellers needing to overcome psychological support at the 92 level to validate the bearish continuation pattern and carve a path for price to fulfil the implied measured move (88.44).
-- Written by Daniel Moss, Analyst for DailyFX
Follow me on Twitter @DanielGMoss


