US Dollar Index, DXY, Federal Reserve Interest Rate Decision, FOMC, Coronavirus – Talking Points:
- Equity markets crept cautiously higher during APAC trade.
- USD could come under further pressure as the FOMC rate decision shifts into focus.
- The US Dollar Index (DXY) at risk of extended declines as price carves out a bearish Head and Shoulders pattern.
Asia-Pacific Recap
Equity markets crept cautiously higher during Asia-Pacific trade as investors shifted their focus towards the Federal Reserve’s upcoming monetary policy meeting. Japan’s Nikkei 225 climbed 0.3%, Hong Kong’s Hang Seng rose 0.17%, and China’s CSI 300 nudged 0.18% higher.
Australia’s ASX 200 index slipped 0.65% as a larger-than-expected rise in the nation’s annual inflation rate suggests that the Reserve Bank of Australia may have to adjust it monetary policy settings ahead of schedule. In FX markets, the cyclically-sensitive AUD, NZD and CAD all slid lower against their major counterparts, while the haven-associated USD and CHF gained ground.
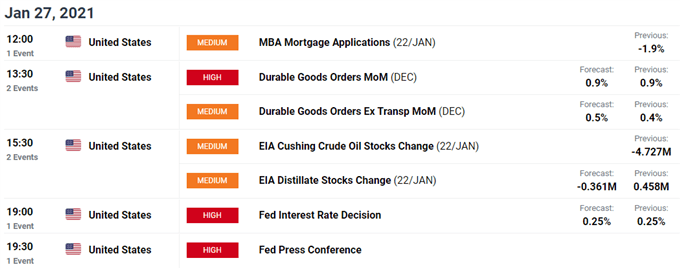
Gold and silver prices drifted lower as yields on US 10-year Treasuries held firm at 1.04%. Looking ahead, the FOMC’s monetary policy meeting headlines the economic docket alongside US durable goods orders for the month of December.

Dovish FOMC to Keep USD on the Backfoot
The US Dollar could come under further pressure against its major counterparts in the near term, as attention shifts towards the Federal Open Market Committee’s (FOMC) upcoming monetary policy meeting. The central bank is expected to keep its monetary policy settings steady while reiterating that accommodative monetary policy conditions are set to endure for the foreseeable future.
At its previous meeting the Federal Reserve stated that it will continue to purchase at least $80 billion of Treasury securities and $40 billion of agency mortgage-backed securities per month “until substantial further progress has been made towards the Committee’s maximum employment and price stability goals”.
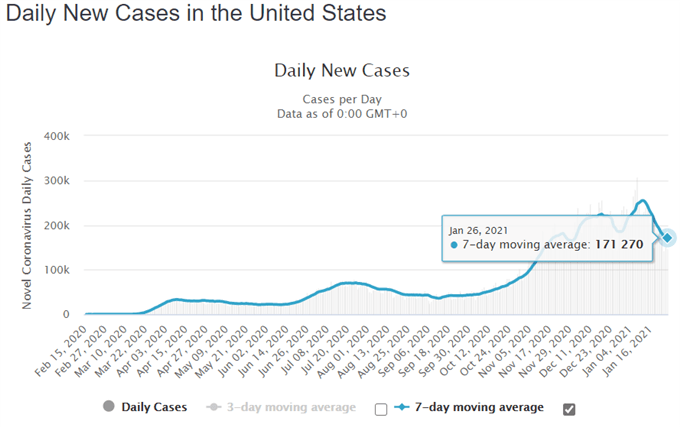
However, with coronavirus infections notably declining in recent days, and the vaccination rate picking up significantly, there is a realistic possibility of the nation beginning to return to some form of normality in the second quarter. This could encourage certain members of the Fed to push for the central bank to begin tapering its purchases later this year.

Source – Worldometer
That being said, with continuing weekly jobless claims hovering above 5 million, and the annual inflation rate still significantly lower than the Fed’s average inflation target of 2%, it appears relatively unlikely that the central bank will hint at tapering its asset purchases at the upcoming meeting.
Indeed, Boston Fed President Eric Rosengren stated that he “expects it to be a little while before we’re even talking about tapering our purchases of government and mortgage-backed securities”. This statement reinforces the comments from Vice Chair Richard Clarida that his “economic outlook is consistent with us keeping the current pace of purchases through the remainder of the year [and] it could be quite some time before we would think about tapering the pace of our purchases”.
Therefore, the reassurance of loose monetary policy conditions, in tandem with the intensifying push for additional deficit spending, may continue to undermine the Greenback against its major counterparts and ultimately drive the US Dollar Index (DXY) lower in the coming months.
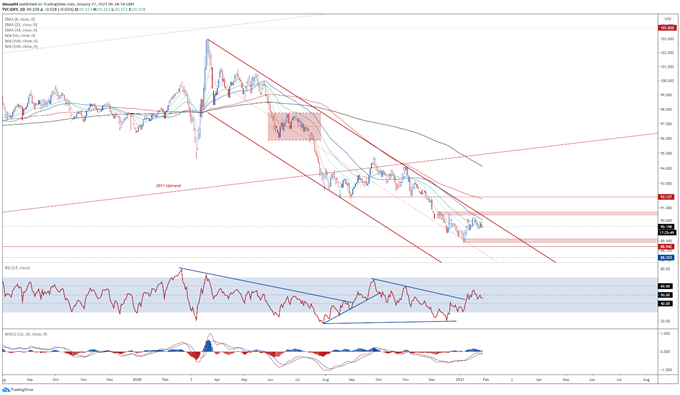
US Dollar Index (DXY) Daily Chart – 50-MA Capping Upside Potential

DXY daily chart created using Tradingview
From a technical perspective, the US Dollar Index (DXY) looks set to continue pushing lower as price fails to break above the trend-defining 50-day moving average (90.64) and remains within the confines of a Descending Channel.
With the RSI dipping below 50, and the MACD gearing up to cross back below its ‘slower’ signal line counterpart, the path of least resistance seems to favour the downside.
A daily close below psychological support at 90.00 would probably intensify selling pressure and open the door for the index to retest range support at 89.20 – 89.40.
Clearing that likely signals the resumption of the primary downtrend and brings the 2018 low (88.25) into the crosshairs.
Alternatively, clambering back above the 21-EMA (90.30) could carve a path for buyers to challenge Descending Channel resistance and the psychologically imposing 91.00 mark.
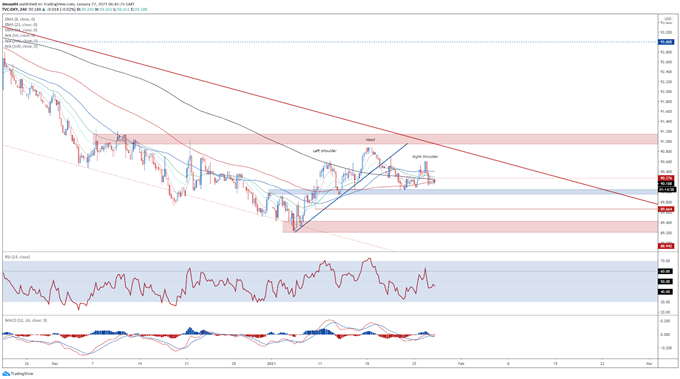
US Dollar Index (DXY) 4-Hour Chart – Head and Shoulders Pattern Hints at Further Losses

DXY 4-hour chart created using Tradingview
Zooming into the four-hour chart bolsters the bearish outlook depicted on the daily timeframe, as prices carve out a Head and Shoulders reversal pattern above range support at 89.95 – 90.05.
A convincing break below 89.90 is required to validate the bearish reversal pattern and propel the index back towards the yearly low (89.21), with the implied measured move suggesting price could fall 1.4% from current levels to test the March 2018 low (88.94).
On the other hand, remaining constructively perched above 90.00 could allow buyers to drive the index back towards the January 26 high (90.61).
-- Written by Daniel Moss, Analyst for DailyFX
Follow me on Twitter @DanielGMoss

