US Dollar Index, Fiscal Stimulus, Coronavirus, Congressional Gridlock – Talking Points:
- Market sentiment notably soured during APAC trade as US fiscal aid hopes continued to fade
- Bipartisan negotiations look set to continue dictating the US Dollar’s outlook ahead of Speaker Pelosi’s proposed deadline.
- US Dollar Index (DXY) remains confined within a bearish Descending Channel formation. Could the absence of much-needed support fuel a topside breakout?
Asia-Pacific Recap
Market sentiment notably soured during Asia-Pacific trade, as investors digested ongoing US fiscal stimulus negotiations ahead of today’s proposed deadline.
The haven-associated US Dollar and Japanese Yen climbed higher against their major counterparts while the risk-sensitive Australian Dollar slid to fresh monthly lows.
Gold held firm and silver crept higher, as yields on US 10-year Treasuries remained unchanged on the day.
Looking ahead, US housing starts figures for September headline the economic data as investors’ focus remains fixated on US fiscal aid talks.
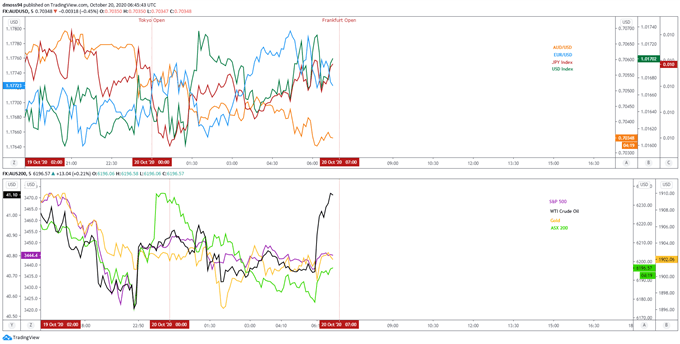
Market reaction chart created using TradingView
US Stimulus Talks to Continue Dictating Sentiment
As noted in previous reports, the ongoing battle between Republicans and Democrats on the specifics of a much-needed, and long overdue, fiscal aid package is likely to continue dictating market sentiment in the near term, after House Speaker Nancy Pelosi announced yesterday that she and Treasury Secretary Steven Mnuchin must reach an agreement within 48 hours “if we want to get it done before the election, which we do”.
Pelosi remains hopeful that “by the end of the day Tuesday, we will have clarity on whether we will be able to pass a bill before the election”, despite balking at the White house’s recent $1.8 trillion proposal that she believes “amounted to one step forward, two steps back”.
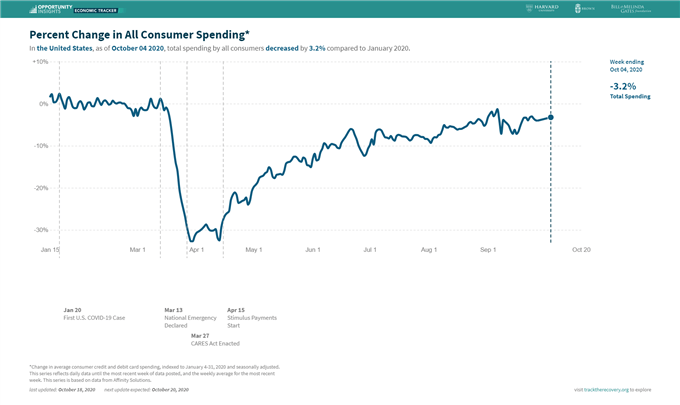
Given that the US is currently averaging more than 55,000 coronavirus infections a day and high-frequency data is showing a marked slowdown in the nation’s nascent economic recovery, the need for additional fiscal support is becoming increasingly urgent.
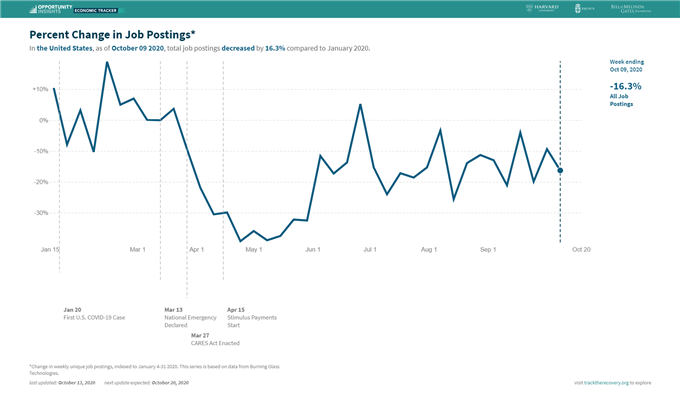
Job postings remain 16.3% lower than pre-crisis level and appear to be trending lower while consumer spending seems to have noticeably plateaued after peaking at the beginning of September.
That being said, the deterioration in economic and health outcomes may fail to prompt US policymakers to act, considering Secretary Mnuchin’s recent comments that “getting something done before the election and executing on that would be difficult”.
Moreover, in the off-chance that a bill is agreed upon there is a distinct possibility that it will be voted-down in the Senate, considering Senate Majority Leader Mitch McConnell favors a significantly narrower aid package that will cost roughly $500 billion and has stated that “the speaker insists on an outrageous amount of money”.
Therefore, it seems relatively unlikely that US policymakers will succeed in getting a deal across the line before the Speaker’s proposed deadline, which may in turn fuel a period of risk aversion and buoy the haven-associated US Dollar.
US Dollar Index (DXY) Daily Chart – Descending Channel Remains Intact
From a technical perspective, the US Dollar Index’s (DXY) outlook remains skewed to the downside, as price continues to track within the confines of a Descending Channel after failing to break above key resistance at the 38.2% Fibonacci (94.06).
However, a short-term rebound back towards channel resistance and the 21-day moving average (93.74) could be in the offing, if support at the trend-defining 50-DMA (93.29) holds firm.
Moreover, with the MACD indicator tracking marginally above its neutral midpoint and the RSI eyeing a cross back above 50, the path of least resistance seems higher.
Failure to snap below the uptrend extending from the yearly low (91.75) could inspire a push back towards the psychologically imposing 94.00 mark, if resistance at the 21-DMA (93.74) gives way.
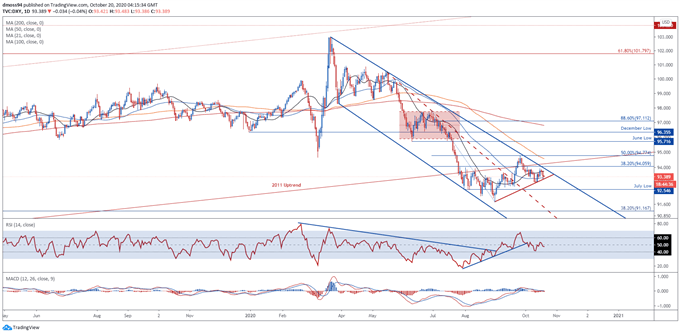
US Dollar Index (DXY) daily chart created using TradingView
US Dollar Index (DXY) 4-Hour Chart – 200-MA Capping Buying Pressure
Zooming into a 4-hour chart however, suggests that further losses could be in the offing, as price remains capped by all four moving averages and the RSI swerves away from its neutral midpoint.
A series of Doji candles just shy of the trend-defining 50-MA (93.45) is indicative of fading bullish momentum and may ultimately inspire a more extensive correction, if buyers fail to breach the 93.50 mark.
With that in mind, a pullback towards uptrend support looks likely in the near term, with a break below the October 19 low (93.21) needed to carve a path for price to test the psychologically pivotal 93.00 level.
Conversely, a break back above the 200-MA (93.50) would probably open the door for price to retest the October 15 swing-high (93.90).
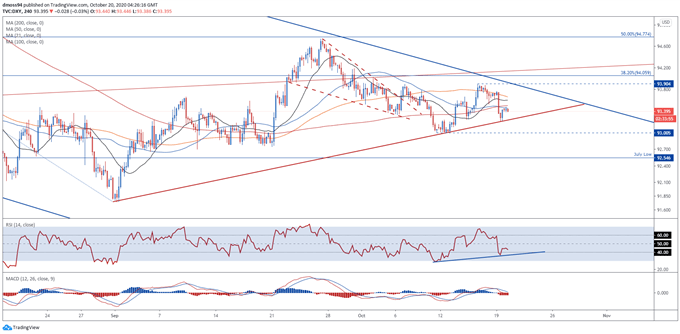
US Dollar Index (DXY) 4-hour chart created using TradingView
-- Written by Daniel Moss, Analyst for DailyFX
Follow me on Twitter @DanielGMoss

