US Dollar, Federal Reserve, Summary of Economic Projections, Treasury Market, DXY – Talking Points:
- Equity markets slipped lower during APAC trade as traders shift focus to the upcoming FOMC meeting.
- The US Dollar’s outlook will likely be dictated by the Federal Reserve’s actions, or lack thereof.
- The US Dollar Index (DXY) is eyeing a push to challenge the 200-MA after bouncing away from key support.
Asia-Pacific Recap
Risk assets drifted lower during Asia-Pacific trade as investors shifted their focus towards the results of the Federal Reserve’s monetary policy meeting. Australia’s ASX 200 and Hong Kong’s Hang Seng Index slipped 0.47% and 0.24% respectively, while Japan’s Nikkei 225 held relatively steady. China’s CSI 300 climbed 0.26%, buoyed by the approval of a fifth coronavirus vaccine locally.
In FX markets, the risk-sensitive AUD and NZD lost ground against their major counterparts, while the haven-associated US Dollar gained ground alongside the Euro and British Pound. Gold extended its recent recovery as yields on 30-year US Treasuries held steady at 2.38%. Looking ahead, all eyes will be intently focused on the FOMC and what its outlook for monetary policy going forward will ultimately be.

FOMC Meeting to Determine Trajectory of USD
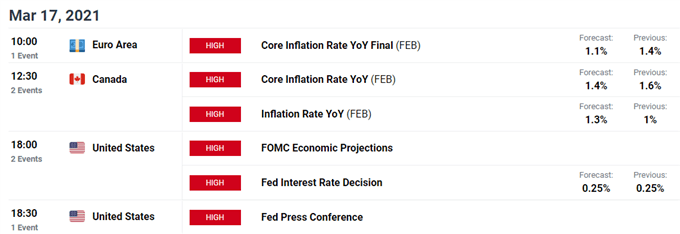
The upcoming FOMC monetary policy meeting will likely define the near-term trajectory of the haven-associated US Dollar, as market participants attempt to gauge whether the Federal Reserve will step-in to cap the recent rise in long-term rates, or perhaps hint at tapering policy measures earlier-than-expected – in response to climbing inflation expectations.
It seems rather unlikely that the central bank will entertain either of the above mentioned actions, given its consistent messaging that it remains a long way away from achieving its mandated inflation and employment goals, and its dismissal of the tumult in Treasury markets as a reflection of optimism surrounding the nation’s economic recovery.
When asked about the rise in longer-term rates in an interview on March 4, Chairman Jerome Powell stated that “it was something that was notable and caught my attention” but failed to hint at any impending action from the central bank. Instead, the Chairman reiterated that the central bank is still a “long way from our goals” and will be patient in assessing when the right time will be to eventually begin tapering monetary policy measures.

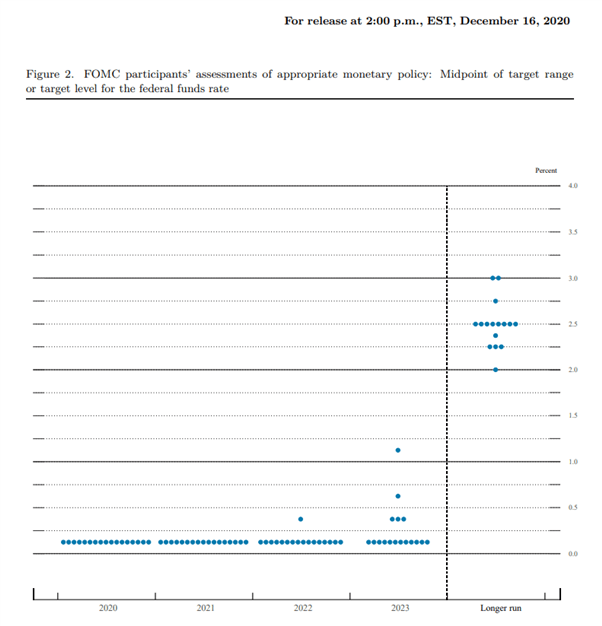
Source – Federal Reserve
This suggests that no changes may be made to the Fed’s monetary policy settings, or the closely-watched Fed Funds rate dot plot, which so far signals that rate hikes will only begin after 2023. However, if this were to be revised higher, a bullish US Dollar reaction is more than likely.
Also in focus is whether or not the Fed will extend exemptions on US Treasuries from the supplementary leverage ratio. Deciding to let this emergency measure expire would ultimately result in banks offloading as much as $600 billion in short-term Treasuries, which could beget selling in longer-term maturities and drive yields higher.
That being said, the overall impact of this net-selling could prove rather brief, given the majority of these holdings are at the front-end of the curve. Therefore, the upcoming meeting could prove volatility-inducing however, if the Federal Reserve sticks to the script, an extended move higher for the US Dollar seems rather unlikely.
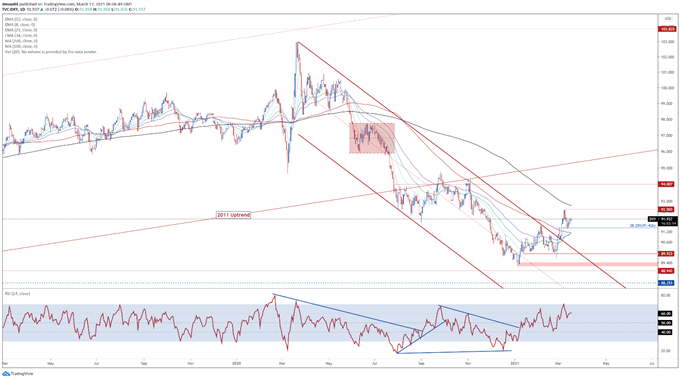
US Dollar Index (DXY) Daily Chart – Gearing Up to Challenge 200-MA?

DXY daily chart created using Tradingview
From a technical perspective, the US Dollar Index (DXY) appears poised to extend its 2-month recovery from multi-year lows, as price surges above the trend-defining 55-EMA (91.08) and remains constructively positioned above the 38.2% Fibonacci (91.43).
With the RSI hovering in bullish territory above 60, and price being guided higher by the 8-EMA (91.74), the path of least resistance seems higher.
A daily close above psychological resistance at 92.00 is needed to bring the yearly high (92.50) and sentiment-defining 200-MA (92.73) into play. Hurdling that could pave the way for the index to challenge the August 2020 high (93.99).
On the other hand, sliding back below the 38.2% Fibonacci (91.43) could intensify selling pressure and result in a reversal back towards the monthly low (90.63).
-- Written by Daniel Moss, Analyst for DailyFX
Follow me on Twitter @DanielGMoss

