US Dollar, DXY, Haven Demand, Covid-19 Vaccine Delay, European Lockdowns – Talking Points:
- Risk assets continued to underperform during APAC trade as renewed lockdowns weighed on market sentiment.
- The divergence in vaccination rates and overall case numbers between the EU and the US may drive the US Dollar Index higher in the coming weeks.
The Quiz
Discover what kind of forex trader you are
Asia-Pacific Recap
A flurry of fresh lockdowns in several European nations has notably soured market sentiment and weighed on risk assets during Asia-Pacific trade. Hong Kong’s Hang Seng Index plunged 2.2% after the city moved to temporarily suspend the distribution of Pfizer and BioNTech’s vaccine due to packaging issues. Japan’s Nikkei 225 dropped 2.04% and China’s CSI 300 fell 1.76%. Australia’s ASX 200 climbed 0.5% on the back of positive PMI figures.
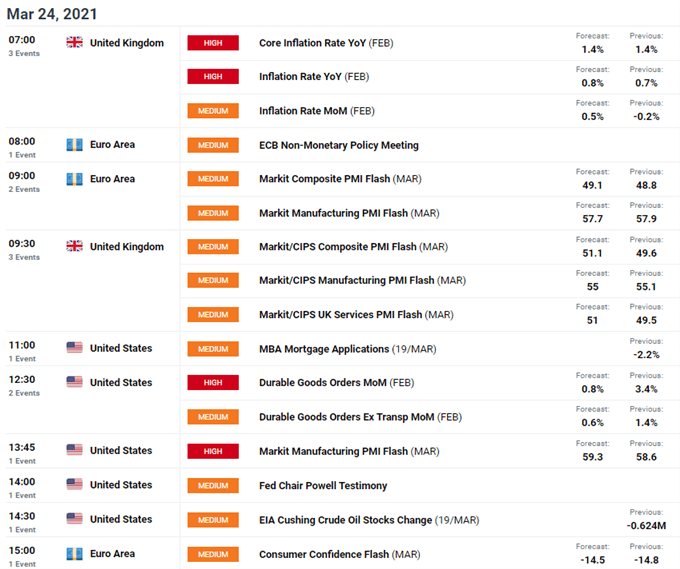
In FX markets, the cyclically-sensitive AUD, NZD and NOK largely outperformed while the haven-associated USD, JPY and CHF gained ground. Gold and silver prices nudged marginally higher as yields on US 10-year Treasuries declined for a third consecutive day. Looking ahead, US durable goods orders and a flurry of PMI figures out of the UK and EU headline the economic docket.

Stagnating Global Rebound Fears to Buoy USD
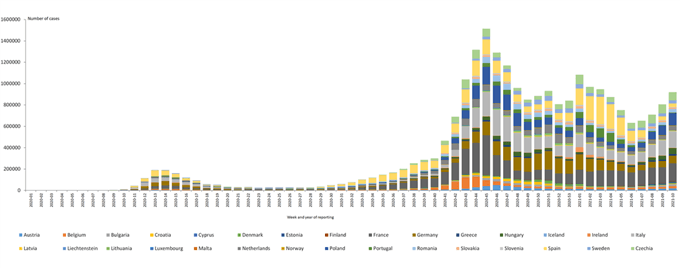
The US Dollar has gained a significant amount of ground against its G10 counterparts lately, on the back of growing concerns that a resurgence of coronavirus infections in Europe could upend the rebound in global economic output.
German Chancellor has announced a five-day snap lockdown starting on April 1, which will see all stores closed, private gatherings limited to one other household, and public meetings banned. A notable increase in Covid-19 cases has also forced France, Italy and the Netherlands to extend their respective restrictive measures.
Indeed, in a joint statement scheduled to be released on Thursday, European Union will stress that as “the epidemiological situation remains serious, [and] in light of the challenges posed by variants, restrictions must continue to be upheld for the time being”.
European Union Weekly Coronavirus Cases

Source – ECDC
The delayed rollout of vaccines, and the resistance from residents in response to reports questioning the safety of AstraZeneca’s shot, could see these measures prolonged even further and in turn result in the reduction of second quarter growth forecasts.
This weakening fundamental backdrop will probably weigh on the Euro, and given the Euro makes up 58% of the US Dollar Index’s (DXY) overall composition, may pave the way for the haven-associated Greenback to continue gaining ground in the short-term.
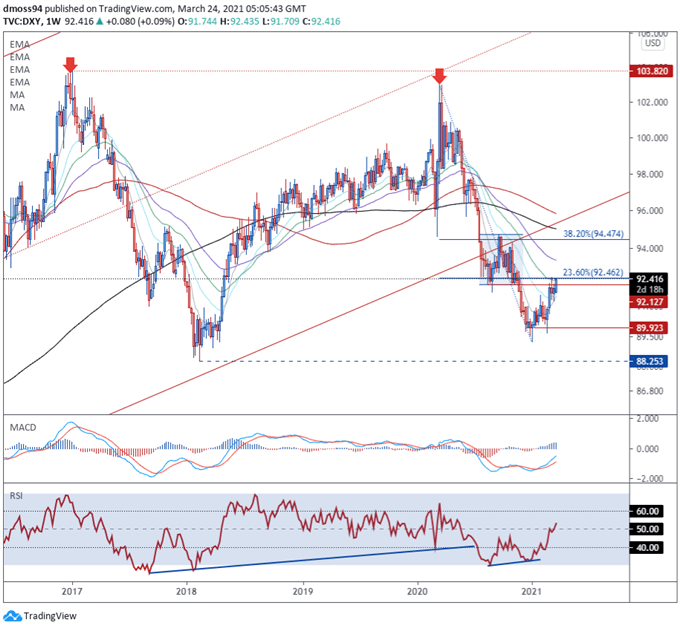
US Dollar Index (DXY) Weekly Chart – Probing 23.6% Fibonacci Retracement

DXY weekly chart created using Tradingview
From a technical perspective, the US Dollar Index (DXY) appears poised to extend its rebound from the January low (89.21), as buyers drive price back above the 8- and 21-EMA to challenge the 23.6% Fibonacci (92.46).
With the RSI climbing back above its neutral midpoint, and a bullish crossover taking place on the MACD indicator, the path of least resistance seems skewed to the topside in the short term.
A weekly close above 92.50 would probably intensify buying pressure and carve a path for the index to test the trend-defining 55-EMA (93.39). Hurdling that brings the 38.2% Fibonacci (94.74) and sentiment-defining 200-MA (95.04).
However, an extended move higher seems relatively unlikely given price formed a bearish Double Top pattern in March of 2020, and has broken convincingly below the uptrend extending from the 2011 lows.
With that in mind, a bearish reaction at the 55-EMA could result in a resumption of the primary downtrend, with a weekly close back below the psychologically imposing 92.00 mark needed to carve a path to retest the yearly low (89.21).
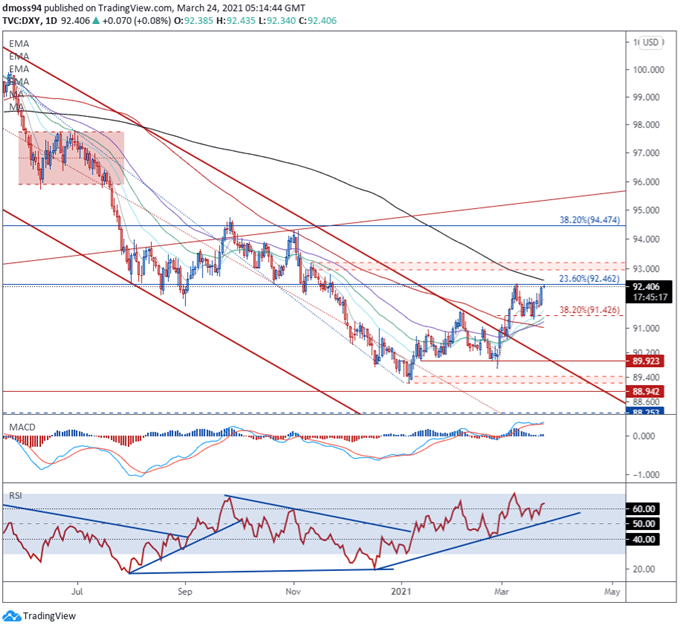
US Dollar Index (DXY) Daily Chart – 200-MA In Focus

DXY daily chart created using Tradingview
Zooming into the daily timeframe bolsters the bullish outlook depicted on the weekly chart, as prices accelerate away from the 38.2% Fibonacci retracement (91.43) of the uptrend extending from the February low to the March 9 high, and eye a push above mobile resistance at the 200-MA (92.61).
The development of both the RSI and MACD is indicative of swelling bullish momentum, as both oscillators track firmly above their respective neutral midpoints.
A daily close above confluent resistance at the 23.6% Fibonacci and 200-MA likely opens the door for price to probe range resistance at 92.95 – 93.20, with a convincing break above drawing the psychologically imposing 94.00 mark into the crosshairs.
However, if Fibonacci resistance remains intact, a reversal back towards the 21-EMA (98.49) could be on the cards.
-- Written by Daniel Moss, Analyst for DailyFX
Follow me on Twitter @DanielGMoss

