S&P 500 Index, Federal Reserve, Tapering Bond Purchases, Quantitative Easing – Talking Points:
- Equity markets crept higher during APAC trade as investors warmed to the idea of additional fiscal stimulus out of the US.
- The suggestion by some members of the Federal Reserve that the central bank should look to taper its QE program could weigh on US benchmark indices.
- S&P 500 index at risk of a near-term pullback after forming a bearish Hanging Man candle just shy of key resistance.
Asia-Pacific Recap
Equity markets cautiously crept higher during Asia-Pacific trade as traders warm to the prospect of additional US fiscal support under an incoming Joe Biden administration. Japan’s Nikkei 225 index nudged 0.1% higher and Hong Kong’s Hang Seng index climbed 0.92%.
China’s CSI 300 index soared 2.6% on the back of a notable drop in local coronavirus infections. In FX markets, the risk-sensitive AUD, NZD, NOK and CAD largely outperformed, while the haven-associated USD, JPY and CHF lost ground against their major counterparts.
Gold and silver prices rebounded higher as yields on US 10-year Treasuries slipped back below 1.15%. Looking ahead, a flurry of speeches from several members of the Federal Reserve headline a rather light economic docket.
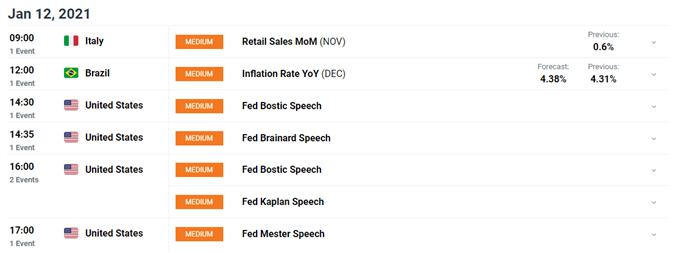
DailyFX Economic Calendar
Federal Reserve Taper Talk, Rising Yields to Undermine S&P 500
Recent comments out of several members of the Federal Reserve hinting at the potential tapering of the central bank’s Quantitative Easing (QE) program, in tandem with climbing real yields, may weigh on the benchmark S&P 500 index in the coming days.
Dallas Fed President Robert Kaplan stated that he would likely to begin a conversation about reducing the central bank’s rate of bond purchasing by the end of this year, while Atlanta Fed President Raphael Bostic also hinted that he would be open to tapering in late-2021.
However, this seems relatively unlikely given the Federal Open Market Committee’s (FOMC) December meeting minutes stated that the central bank will continue to purchase at least $80 billion of Treasury securities and $40 billion of agency mortgage-backed securities per month “until substantial further progress has been made toward the Committee’s maximum employment and price stability goals”.
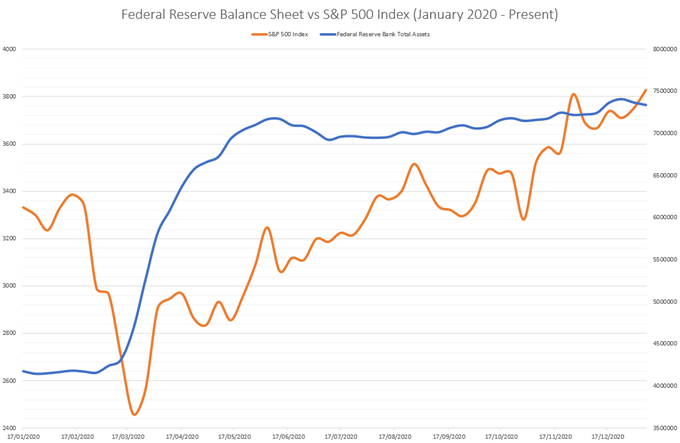
Source – Bloomberg
Moreover, with December’s non-farm payrolls report showing that the local economy shed 140,000 jobs, and the nation’s 7-day moving average tracking coronavirus infections spiking to 254,000, accommodative monetary policy settings are likely required for the foreseeable future.
Indeed, Vice Chair Richard Clarida reiterated that his “economic outlook is consistent with us keeping the current pace of purchases throughout the remainder of the year”, adding that “it could be quite some time before we would think about tapering the pace of our purchases”.
Nevertheless, the sheer mention of the word taper may send shivers down the spines of regional investors and undermine risk appetite in the near term, as attention turns towards Thursday’s release of consumer price growth data for December. An unexpected rise in inflation may stoke bets that the Fed will indeed cut back on it bond purchases and in turn stoke further risk aversion.
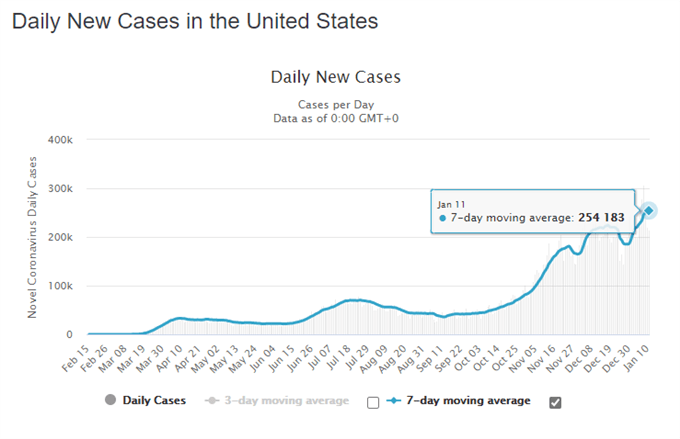
Source – Worldometer
S&P 500 Index Futures Daily Chart – Fading Volume Hints at Near-Term Pullback
From a technical perspective, the S&P 500 index appears to be at risk of a near-term pullback as a Hanging Man reversal candle forms just shy of the yearly high (3824.5) set on January 8.
With volume notably fading, and the RSI struggling to push into overbought territory, a reversal back towards the December high (3753) seems likely.
However, bullish moving average stacking, in tandem with the MACD indicator holding firmly above it neutral midpoint, suggests the path of least resistance in the medium term remains skewed to the topside.
Failing to gain a firm foothold above 3825 on a daily close basis would probably allow sellers to drive the index back towards psychological support at 3750. A convincing push below that likely brings the uptrend extending from the March 2020 low and 34-EMA (3687) into play.
Conversely, if the 8-EMA (3770) is successful in stymieing selling pressure, an impulsive topside surge to challenge the 100% Fibonacci (3860) could be in the offing.
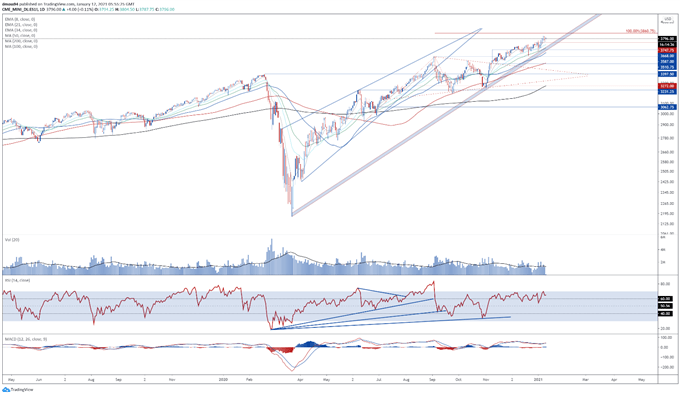
S&P 500 index futures daily chart created using Tradingview
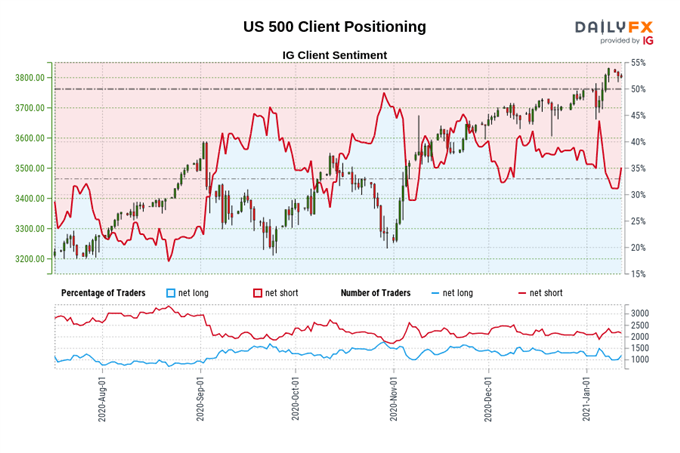
The IG Client Sentiment Report shows 35.32% of traders are net-long with the ratio of traders short to long at 1.83 to 1. The number of traders net-long is 20.22% higher than yesterday and 21.01% lower from last week, while the number of traders net-short is 0.65% lower than yesterday and 15.98% higher from last week.
We typically take a contrarian view to crowd sentiment, and the fact traders are net-short suggests S&P 500 prices may continue to rise.
Positioning is less net-short than yesterday but more net-short from last week. The combination of current sentiment and recent changes gives us a further mixed S&P 500 trading bias.
-- Written by Daniel Moss, Analyst for DailyFX
Follow me on Twitter @DanielGMoss

