S&P 500 Index, Congressional Stimulus Negotiations, Q3 Earnings Season, Federal Reserve – Talking Points:
- Equity markets slid lower during APAC trade as Covid-19 second wave concerns weighed on growth-sensitive assets.
- The absence of a fiscal aid package this side of the US presidential election may divert capital to ‘safe havens’ in the coming days.
- S&P 500 index is at risk of further losses as price struggle to push above key resistance.
Asia-Pacific Recap
Equity markets slid lower during the Asia-Pacific trading session, as a record surge in coronavirus cases notably weighed on growth-sensitive assets.
The Australian ASX 200 index plunged 1.7% despite Victoria, the nation second most populous state, recording no new Covid-19 cases for the second successive day, while Hong Kong’s Hang Seng index slid 0.46%.
Surprisingly, the cyclically-sensitive Australia, New Zealand and Canadian Dollars outperformed the haven-associated Japanese Yen and US Dollar, as crude oil prices recovered lost ground.
Gold nudged marginally higher while silver climbed over 1%, as yields on US 10-year Treasuries held firm at 0.80%.
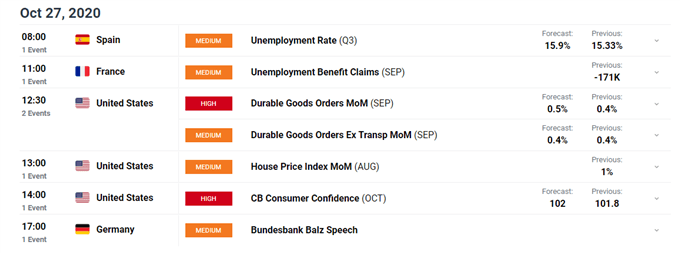
Looking ahead, Spanish third-quarter unemployment figures headline the economic docket alongside US durable goods orders for the month of September.

DailyFX Economic Calendar
Positive Earnings Season Dismissed by Investors
Despite a relatively positive earnings season, the US benchmark S&P 500 index has fallen as much as 5% from the monthly high set on October 12 (3541), as pre-election jitters and fading fiscal stimulus hopes continue to weigh on market sentiment.
120 out of the 145 S&P 500 companies that have reported third-quarter profits beat bottom-line expectations for earnings, while 108 beat sales estimates.
With only 7 days until the US presidential election and the Senate set to leave for break after successfully confirming Supreme Court nominee Amy Coney Barrett, the provision of much-needed fiscal support this side of November 3 appears almost impossible.

Data Source – Bloomberg
The inability of US policymakers to break the deadlock in bipartisan negotiations is likely to concern several members of the Federal Reserve, with Chairman Jerome Powell warning that the absence of “an additional pandemic-related fiscal package” could see growth “decelerate at a faster-than-expected pace in the fourth quarter” and governor Lael Brainard stating that “apart from the course of the virus itself, the most significant downside risk to my outlook would be the failure of additional fiscal support to materialize”.
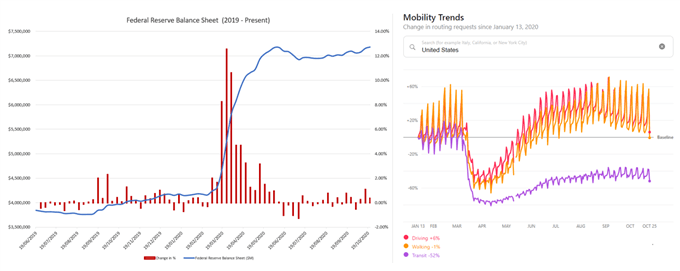
In fact, with the central bank’s balance sheet expanding for three-consecutive weeks for the first time since June, it seems as though the Federal Reserve may attempt to pick up the slack in the interim, which could limit the potential downside for regional equity prices.
That being said, with the US averaging over 70,000 new cases of coronavirus a day and high-frequency data showing a notable slowdown in all three mobility trends – driving, walking and transit – a period of risk aversion looks likely in the coming days.
Therefore, the S&P 500 index could extend its declines ahead of the US presidential election on November 3, should investors cut back on their exposure to risk-associated assets in the absence of additional fiscal support.

Data Source – Bloomberg, Apple Mobility Data
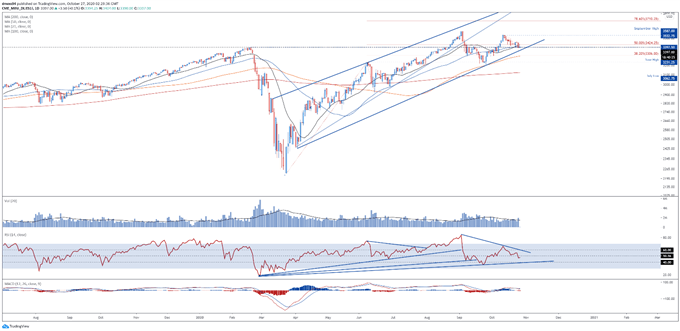
S&P 500 Index Futures Daily Chart – Support at 3350 May Prove Pivotal
From a technical perspective, the S&P 500 index could be poised to rebound back towards the monthly high (3541), as price holds above confluent support at the February high (3397.50) and trend-defining 50-day moving average.
However, a bearish crossover on the MACD indicator, in tandem with the RSI tracking below its neutral midpoint, suggests that the path of least resistance is lower.
A daily close below the October 26 low (3356) is needed to invalidate the Ascending Channel pattern that has guided price higher over the last 7 months and carve a path to test the 38.2% Fibonacci (3306).
Conversely, a break back above the 21-DMA could inspire a more extended topside push and bring the October high (3541) into focus.

S&P 500 index futures daily chart created using TradingView
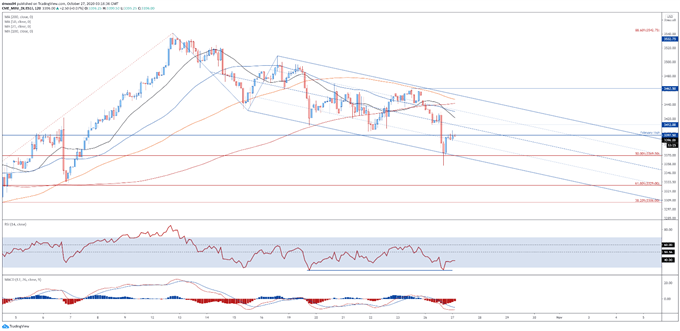
S&P 500 Index Futures 2-Hour Chart – Descending Pitchfork Guiding Price
Zooming into a 2-hour chart however, suggests that price could continue to rebound higher, as buyers successfully defend support at the 50% Fibonacci (3369.50) and drive the S&P 500 index back above the February high (3397.50).
Moreover, a bullish crossover on the MACD indicator may encourage would-be buyers and ultimately ignite a push back towards the 200-MA (3442.45), if resistance at the pitchfork median and October 26 low (3412) gives way.
On the other hand, a continuation of the index’s two-week downtrend could be in the offing if resistance holds firms, with a breach below the 3350 mark potentially opening the door for a push back towards the 61.8% Fibonacci (3329).

S&P 500 index futures 2-hour chart created using TradingView
-- Written by Daniel Moss, Analyst for DailyFX
Follow me on Twitter @DanielGMoss

