S&P 500 Index, Janet Yellen, US Fiscal Aid, President-elect Joe Biden, IGCS – Talking Points:
- Equity markets broadly gained during APAC trade on the back of positive earnings and stimulus prospects.
- Treasury Secretary nominee Janet Yellen’s calls for additional fiscal support may buoy US benchmark equity indices.
- The S&P 500 index appears poised to push to fresh yearly highs after storming away from key support.
Asia-Pacific Recap
Equity markets broadly gained during Asia-Pacific trade, on the back of a slew of positive earnings releases and the prospect of addition fiscal support out of the US. Australia’s ASX 200 climbed 0.41%, China’s CSI 300 rose 0.72% and Hong Kong’s Hang Seng index soared just under 1%.
In FX markets, the haven-linked US Dollar, Japanese Yen and Swiss France lost ground while the cyclically-sensitive Australian and New Zealand Dollars largely outperformed. Gold and silver prices also gained ground as yields on US 10-year Treasuries held firm at 1.09%.
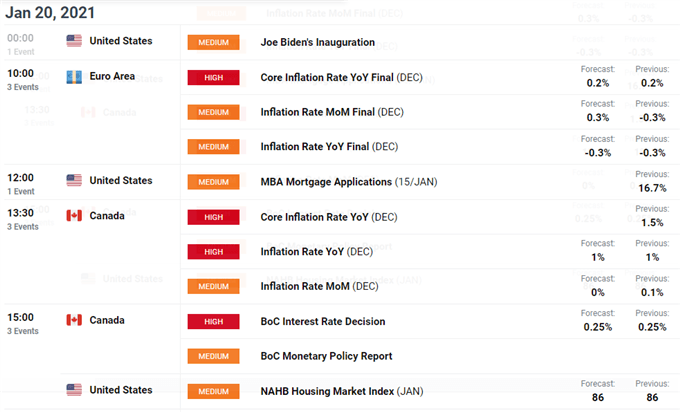
Looking ahead, Euro-area inflation data for December headlines the economic docket alongside the Bank of Canada’s monetary policy meeting.

DailyFX Economic Calendar
Yellen’s Calls for Further Fiscal Support to Buoy US Equities
The US benchmark S&P 500 index climbed 0.81% higher overnight on the back of comments by Treasury Secretary nominee Janet Yellen at her Senate hearing, with the former Federal Reserve Chair pushing for additional deficit spending to bolster the nation’s nascent economic recovery.
Yellen stated that “economists don’t always agree, but I think there is a consensus now that without further action we risk a longer, more painful recession now – and long-term scarring of the economy later”, adding that “over the next few months, we are going to need more aid to distribute the vaccine, to reopen schools and to help states keep firefighters and teachers on the job”.
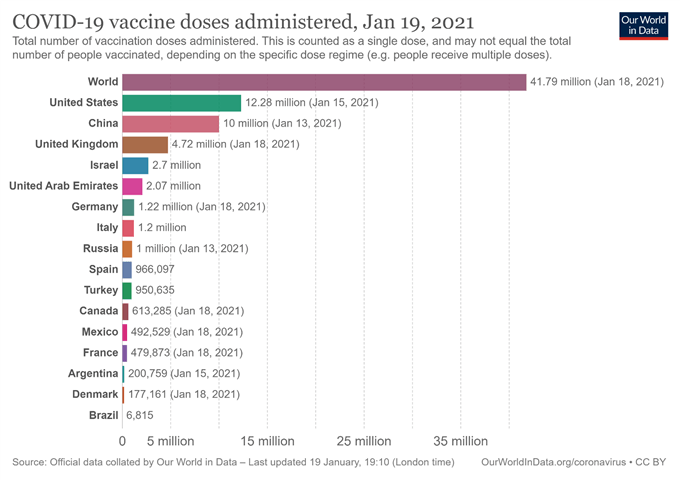
Given the total number of vaccine doses administered drastically lags behind initial forecasts of 20 million inoculations by the end of 2020, and the non-farm payrolls report for December showed the economy shed 140,000 jobs, the provision of further support seems almost a necessity.

However, Senate Republicans continue to oppose President-elect Joe Biden $1.9 trillion stimulus proposal. Senator Pat Toomey, the second-most senior Republican in the Senate, stated that “the only organizing principle that I can discern [behind this plan] is it seems to spend as much money as possible, seemingly for the sake of spending it”.
The GOP also highlighted the government’s swelling debt load as a reason to pull back on additional spending. That being said, Yellen’s concerns that avoiding “doing what we need to do now to address the pandemic and the economic damage that its causing, would likely leave us in a worse place fiscally”, may encourage both sides of the aisle to see eye-to-eye.
Therefore, the prospect of a more extensive fiscal support package in the coming months may act as a tailwind for risk-sensitive assets and drive the S&P 500 index to fresh yearly highs.
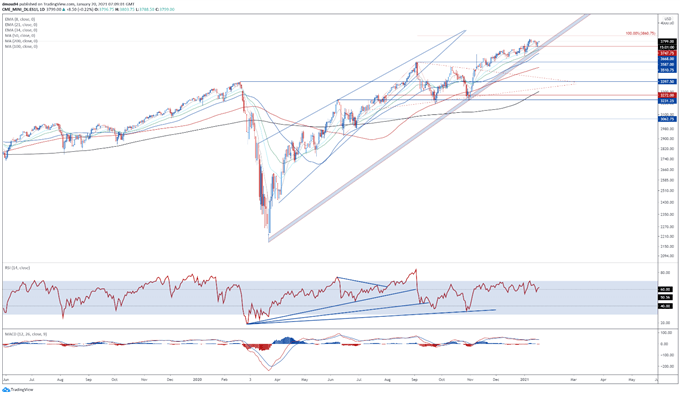
S&P 500 Index Futures Daily Chart – 100% Fibonacci Expansion in Focus

S&P 500 index futures daily chart created using Tradingview
From a technical perspective, the S&P 500 index looks set to extend its recent push higher after bouncing away from former resistance-turned support at the December 2020 high (3753).
Bullish moving average stacking, in tandem with the RSI hovering above 60, suggests that the path of least resistance is skewed to the topside.
A daily close above the January 8 high (3824) would likely generate a push to challenge the 100% Fibonacci expansion level (3860). Clearing that probably opens the door for buyers to begin probing the psychologically imposing 3900 mark.
Alternatively, sliding back below the 8-day exponential moving average (3784) could trigger a pullback to confluent support at the uptrend extending from the March 2020 nadir and last year’s high (3753). Breaching that may intensify selling pressure in the near term and propel price back towards psychological support at 3600.

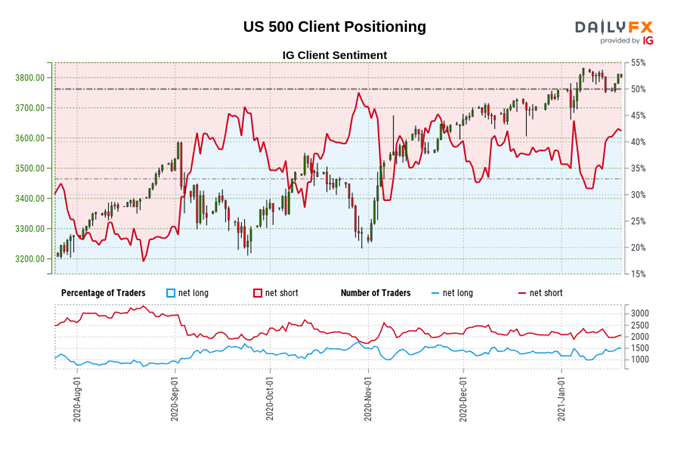
The IG Client Sentiment Report shows 41.56% of traders are net-long with the ratio of traders short to long at 1.41 to 1. The number of traders net-long is 0.20% higher than yesterday and 19.37% higher from last week, while the number of traders net-short is 4.70% higher than yesterday and 5.99% lower from last week.
We typically take a contrarian view to crowd sentiment, and the fact traders are net-short suggests S&P 500 prices may continue to rise.
Positioning is more net-short than yesterday but less net-short from last week. The combination of current sentiment and recent changes gives us a further mixed S&P 500 trading bias.
-- Written by Daniel Moss, Analyst for DailyFX
Follow me on Twitter @DanielGMoss

