AUD/NZD, RBNZ, US Yield Curve – Talking Points
- Investors in US equity indexes continue to rotate out of tech following risk clarity post-election
- Their outlook on the economy may be strengthening as 10-year Treasury yields climb
- AUD/NZD may strengthen if RBNZ signals further willingness to shift to negative rates
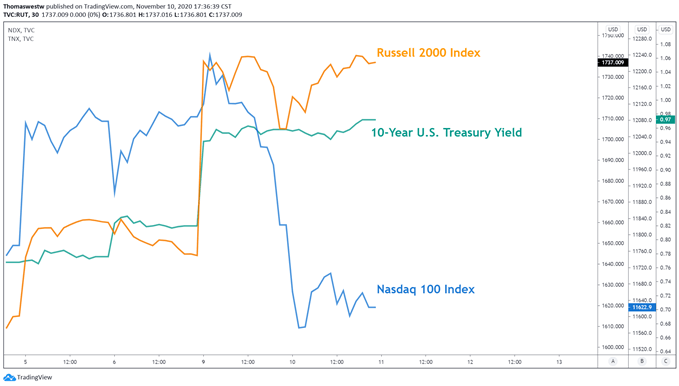
The Dow Jones Index closed 0.90% higher on the day while the Russell 200 Index rocketed over 5%, its highest level since August 2018. Meanwhile, the tech-heavy Nasdaq 100 Index closed 1.74% lower, marking a second consecutive daily loss. The divergence in price action shows a classic rotation trade among investors. At the same time, the 10-year Treasury yield neared 1%, as back-end tenors on the yield curve rise, signaling confidence in investor outlooks.
Russell 2000, Nasdaq 100, U.S. 10-Year Yield – 30 Min Chart

Chart created with TradingView
The rotation away from tech stands in stark contrast to the story seen since late March. It likely owes to several headline risks that have driven market sentiment, such as Covid and the U.S. Presidential Election, gaining clarity over the past week. That said, markets appear to be continuing to price in growth, but the rebalancing signals that high-growth tech stocks may be falling out of favor.
Wednesday’s Asia Pacific Trading Session
The Reserve Bank of New Zealand’s interest rate decision is slated to cross the wires today. According to the DailyFX Economic Calendar, the RBNZ is expected to hold rates steady at 0.25%. Granted, traders will still key in on any details surrounding the outlook, particularly any hints on the central bank’s path towards taking interest rates negative.
Overnight index swaps are pricing in a cut that would take rates negative next year. And most economists also expect the bank to go negative. Still, we may not get a rate projection from today’s decision. Following last week’s RBA decision that cut rates to 0.10% from 0.25%, any guidance that suggests the RRBNZ is shifting further towards negative rates may see AUD/NZD strengthen.
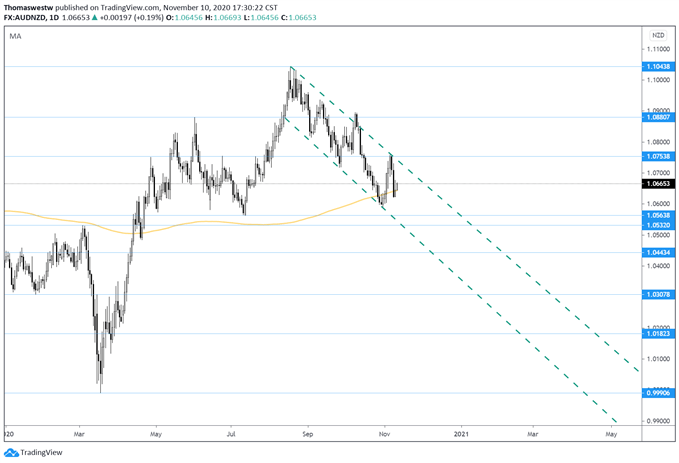
Currently, AUD/NZD continues to trade within a downward channel since pivoting off a multi-year high in August. Tensions between China and Australia have weighed on the Australian Dollar in recent months due to trade disputes. The 200-day moving average, currently at 1.0644, is in play.. A break lower would likely see another retest of the bottom of the channel, and a break higher would aim to test the upper bound.
AUD/NZD – Daily Chart

Chart created with TradingView
Written by Thomas Westwater, Analyst for DailyFX.com
Contact Thomas at @FxWestwater


