New Zealand Dollar, NZD/USD, Trade data, Economic Data -Talking Points
- New Zealand trade data shows positive economic momentum
- Westpac moves OCR hike timeline forward to August 2022
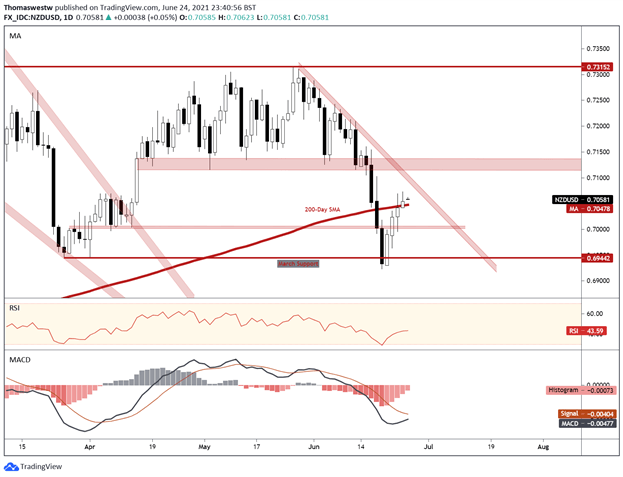
- NZD/USD clears the 200-day SMA, focus shifts to trendline
Friday’s Asia-Pacific Outlook
New Zealand released trade data for May on Friday morning, with exports and imports crossing the wires at N$5.87 billion and N$5.40 billion, respectively. The aggregate balance rose to N$469 million, according to the DailyFX Economic Calendar. The Kiwi Dollar is on pace for a fourth daily gain against the Greenback after last week’s FOMC-induced selloff.
The island nation’s economic situation continues to improve, noted by Westpac shifting its forecast forward for a rate hike in the overnight cash rate (OCR). Michael Gordon, Westpac’s acting NZ Chief Economist, stated that the OCR is seen rising to 2% by the end of 2024 and that the economy’s recovery is performing well. The upgraded forecast may help lift underlying NZD strength.
Elsewhere, South Korea’s business confidence index increased to 98 for June, up from 96. Later today, Japan will see consumer price index (CPI) figures for Tokyo cross the wires, with analysts expecting the June figure to tick up to -0.1% from -0.2% on a year-over-year basis. The Asia-Pacific session will wrap up with foreign exchange reserves for the week ending June 18 out of India.
Equity markets may move higher to close the week out following Wall Street’s upbeat Thursday session when the benchmark S&P 500 index closed at a record high. Market sentiment was bolstered after the Federal Reserve announced positive results for the annual financial stress test. Moreover, President Biden announced that an infrastructure agreement between a bipartisan group of senators was struck.
Traders will be eyeing US inflation figures to cap off the trading week, with US personal consumption expenditures set to cross the wires in Friday’s New York session. The Fed’s preferred metric, core PCE – which strips out food and energy prices – is expected to drop at 3.4% on a YoY basis, up from the prior month’s 3.1%. A better-than-expected inflation figure could see traders possibly price in a more hawkish Fed.
NZD/USD Technical Outlook:
The New Zealand Dollar rose above its 200-day Simple Moving Average (SMA) overnight, with NZD/USD recording a fourth consecutive daily gain. The currency pair is approaching a descending trendline formed off the May swing high, which could pose as resistance. The MACD line is aiming higher, potentially nearing a cross above its signal line, a bullish signal. Alternatively, a drop lower may see the 200-day SMA provide support.
NZD/USD Daily Chart

Chart created with TradingView
New Zealand Dollar TRADING RESOURCES
- Just getting started? See our beginners’ guide for FX traders
- What is your trading personality? Take our quiz to find out
- Join a free webinar and have your trading questions answered
--- Written by Thomas Westwater, Analyst for DailyFX.com
To contact Thomas, use the comments section below or @FxWestwateron Twitter

