Gold, XAU, GLD Price Analysis
- Gold prices rushed up to another fresh seven-year-high to kick of this week’s trade.
- Comments from Jerome Powell on the television show 60 Minutes seemed to give another shot-in-the-arm to the risk trade, as Chair Powell said that there were ‘no limits’ to what the FOMC can do with the lending programs available.
- The highlight of this week’s economic calendar are inflation prints out of Europe, the UK and Canada, and out of the US, FOMC Minutes are released on Wednesday afternoon.
Gold Rushes up to Another Fresh Seven-Year-High
The month of March was a major inflection point in global markets, and with a little hindsight, that fact has become even more clear. While stocks spent much of the month in a precipitous decline, the final week of March was marked by strength in the risk-on trade as global governments, the US in particular, rushed to markets with multiple streams of stimulus. What started as an apparent short-cover rally soon turned into a fresh bullish trend; and almost 40% later, US stocks are continuing to climb as the series of stimulus programs and government action have so far helped to arrest that fear.
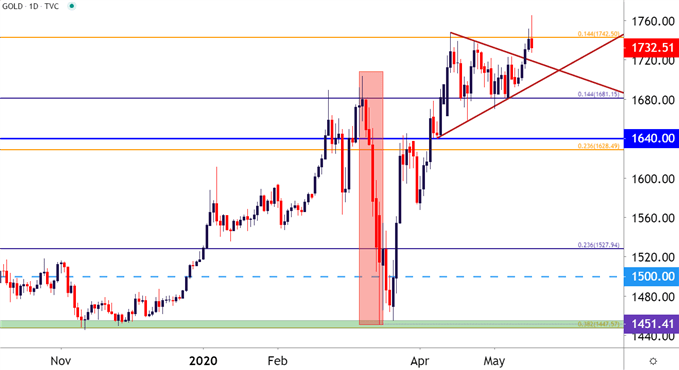
This theme was on display in Gold prices, in a couple of different ways. As panic was heating up in early-March, Gold prices fell by almost 15% as the US Dollar rallied by as much as 8.8%. Normally, investors might expect risk aversion to help Gold prices but in this case, and in others where deflation is a realistic prospect and investors are rushing for cash – Gold can sell-off, as well. Case in point, during the depths of the Financial Collapse gold prices fell by more than 33% over a six-month-stretch. But in March, the yellow metal put in almost half of that move in a week as panic alarms rang the world-around.
Gold Daily Price Chart

Chart prepared by James Stanley; Gold on Tradingview
In the latter portion of the month, recovery began to show in both stocks and gold prices; but given the timing and the fact that this drive may have been emanating from end-of-quarter flows, it was difficult to discern whether it was a legitimate bullish trend brought upon by loads of stimulus or a mere pullback in a longer-term, bigger-picture sell-off.
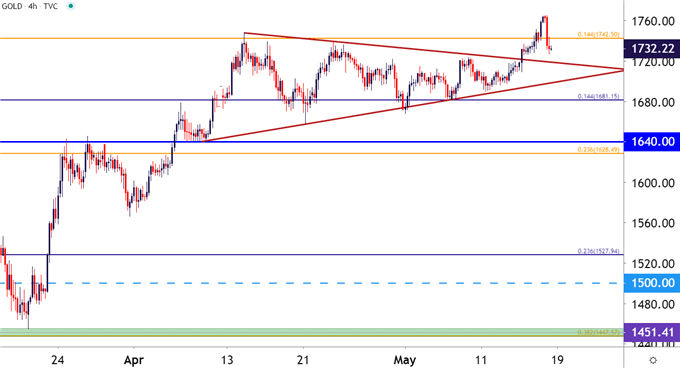
The month of April helped to provide some clarity as both stocks and gold continued to rally, with the latter hitting a fresh seven-year-high on April 14th.
The next month, from the April 14th into the May 14th breakout, Gold prices digested those prior gains in the form of a symmetrical wedge. And when that wedge was combined with the prior bullish trend, that made for a bull pennant formation that began to give way last week as buyers hit the bid to create another fresh seven-year-high. (To learn more about pennant formations, the recently revamped education section of DailyFX touches on the topic.)
Gold Four-Hour Price Chart

Chart prepared by James Stanley; Gold on Tradingview
Gold Jumps After Weekly Open, Potential for More Stimulus
There’ve been a few noteworthy moments around Central Banks in the past couple of months. Jerome Powell has discussed stimulus options numerous times, but it was perhaps the comments from an appearance on the television show 60 Minutes last night that seemed to have really stirred the pot.
The interviewer, Mr. Scott Pelley, asked the very direct question of ‘Has the Fed done all that it can do?’
Mr. Jerome Powell responded: “Well, there is a lot more we can do. We’re not out of ammunition by a long shot. No, there’s, there’s really no limit to what we can do with these lending programs we have.”
This may have just been Mr. Powell’s ‘whatever it takes’ moment, harkening back to the promise from Mario Draghi pledged during the depths of the European Financial Collapse that finally helped to restore order to the bloc. It’s also something that can help to build an even stronger fundamental case for Gold forecasts as a busy Fed firing numerous lending programs at the same time may bring about conditions similar to the 2009-2011 backdrop; as Gold prices surged up to an all-time-high of $1920 as global governments were showering the world (and markets) with liquidity.
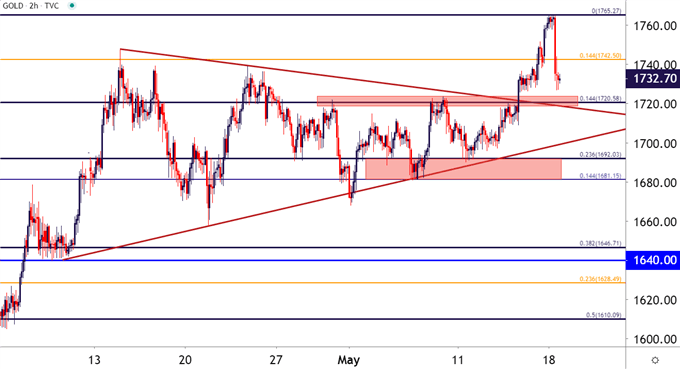
From a shorter-term perspective, this morning’s pullback appears to be more technical in nature as an already overbought market caught another shot-in-the-arm with those comments from the television program last night. This could keep the search on for support, with potential areas of interest around 1720 and a bit lower around 1692. The former of those levels is the 14.4% Fibonacci retracement, the latter the 23.6% marker of the March-May bullish move.
Gold Price Two-Hour Chart

Chart prepared by James Stanley; Gold on Tradingview
--- Written by James Stanley, Strategist for DailyFX.com
Contact and follow James on Twitter: @JStanleyFX

