Gold Price Forecast:
- When good news goes wrong, at least for Gold bulls. Gold has put in a massive bearish move of -5% on positive news of a Covid vaccine.
- Gold prices had broken out from the falling wedge formation late last week, giving the appearance that bullish continuation might be in the cards. That has reversed aggressively.
- This covid news is still relatively new and the situation remains fluid: Be prepared for continued volatility in Gold and other macro markets.
- The analysis contained in article relies on price action and chart formations. To learn more about price action or chart patterns, check out our DailyFX Education section.
The resounding driver across global markets today is one driven by hope: If you’re reading this you probably already know that Pfizer has announced some pretty positive results for their Covid vaccine. This entails apparently a +90% efficacy rate and a protection span of at least a month. But, perhaps the more exciting part of the announcement is the way that the vaccine works, as Pfizer’s drug relies on messenger RNA (mRNA) for inoculation. This is similar to other Covid drugs in the pipeline, such as the one produced by Moderna, and this provides for even more hope as a failure from Pfizer could be rectified by another candidate.
Interestingly – the US equity index that experienced the largest push to start the week is also the one that stripped Pfizer out of the index less than three months ago…
The Dow Jones Industrial Average had Pfizer as one of their 30 companies for a long time; but in August, moved to take Pfizer out of the index to account for re-balancing in Apple after their stock split. That seemed to matter little to equity traders this morning, however, as the Dow jumped by as much as 6% from the Friday close, well above the max gain of 4.48% for the S&P 500 and the 3% for the Nasdaq. Those moves have already moderated a little bit but one item that hasn’t yet backed down is Gold.
Gold prices came into the weekend after a fresh breakout in the latter portion of last week. And this very much synced with the big picture trajectory in Gold, in which months of digestion took on the form of a falling wedge, only to give way to another push of buying pressure. This led to all time-highs in August; but that’s when another round of digestion began – and that held all the way into last week.
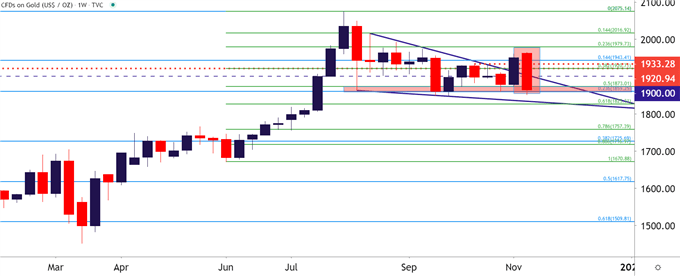
Also of interest and highlight just how supercharged this move has been: Notice on the below chart how the weekly bar is already showing as a bearish engulfing pattern. This, of course, isn’t yet confirmed because we have the rest of the week but the fact that this has already built-in on Monday is definitely an interesting point to consider for anyone analyzing Gold at the moment.
To learn more about bearish engulfing patterns, check out DailyFX Education
Gold Weekly Price Chart

Chart prepared by James Stanley; Gold on Tradingview
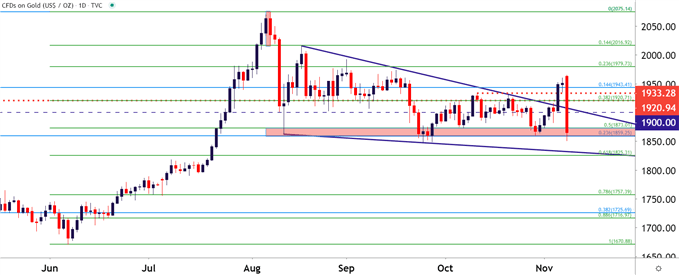
At this point, Gold prices have slammed down to a fresh monthly low, and this has been in an aggressive fashion as the yellow metal has dropped by as much as $114 and more than 5%. Prices are posturing in a key zone, running from 1859-1871 on the chart, and this is the same area that came into play in both August, September and October to help set the lows.
The big question is whether the fourth time is a charm or a curse?
Gold Daily Price Chart

Chart prepared by James Stanley; Gold on Tradingview
--- Written by James Stanley, Strategist for DailyFX.com
Contact and follow James on Twitter: @JStanleyFX


