Gold Price Forecast
- Gold Prices have been displaying mean reversion over the past couple of weeks.
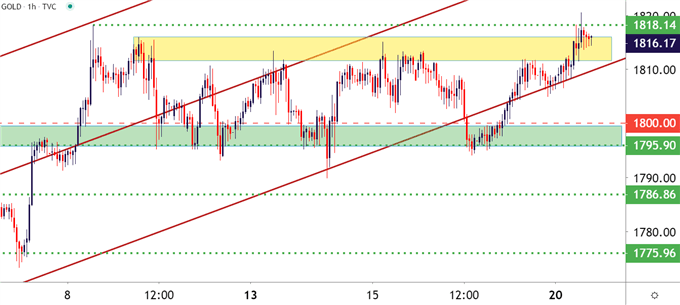
- While support from the 1796-1800 area has held a few different tests, the resistance side of that range is currently seeing pressure as price action threatens a bullish breakout.
- This morning saw the print of another fresh eight-year-high but, as yet, buyers haven’t been able to drive the trend with a series of higher-highs and higher-lows.
Gold Prices Set Fresh Eight-Year-High
Gold prices started off the week with a bang, pushing up to a fresh eight-year-high at an area that has seen multiple resistance inflections over the past few weeks. Last week saw a support test in a familiar area, spanning from the 1796 prior high up to the 1800 psychological level; and, collectively, these zones of support and resistance help to demarcate a shorter-term range that’s built-in after that bullish advance in Gold prices.
Gold Price Hourly Chart

Chart prepared by James Stanley; Gold on Tradingview
Gold Bulls Remain in-Charge for Now
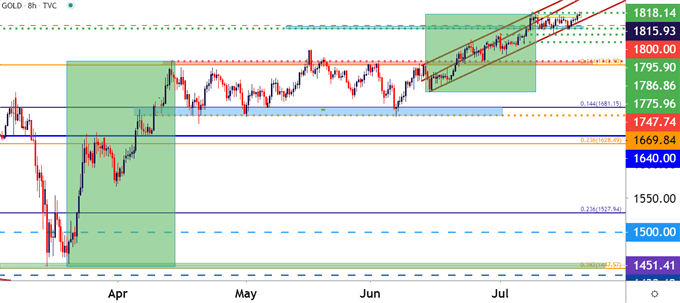
Taking a step back and looking at Gold prices since the March low, and there have been two major bullish trends. The first took place from the March lows into the mid-April highs; after which Gold prices built into a range that lasted for much of the next two months. The next bullish trend showed up as prices broke-out of that April-June range and trended-higher into early-July, eventually setting that fresh eight-year-high above the 1800 level.
The big question now is whether we’re seeing a third bullish trend form from those March lows; or whether buyers are rebuked as price action tests a fresh high.
Gold Price Eight-Hour Chart

Chart prepared by James Stanley; Gold on Tradingview
--- Written by James Stanley, Strategist for DailyFX.com
Contact and follow James on Twitter: @JStanleyFX

