Gold Price Forecast Talking Points:
- Gold prices closed the month of August with a Doji, likely disappointing to bulls that drove the bid to fresh all-time-highs in the first week of last month.
- So far September has started out with a slide as Gold prices have reverted to a key area of chart support.
- While last week’s comments from Chair Powell were seemingly supportive of both Gold strength and USD-weakness, both of those themes have remained on hold since. Will tomorrow’s NFP report spur Gold bulls into action?
- To learn more about price action, check out our DailyFX Education section, where it’s taught amongst a host of other candlestick patterns and formations.
Gold Bulls on Break as Digestion Continues
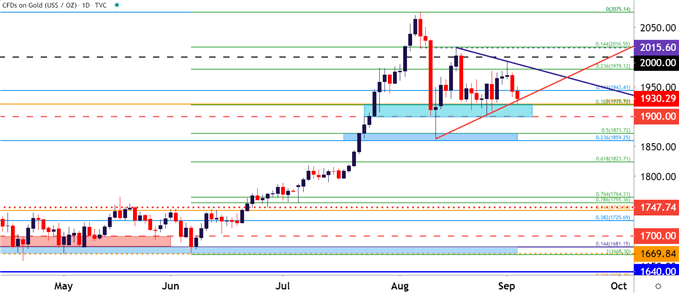
This can change rather fast in global markets, especially when there’s a backdrop of a global pandemic and a ton of uncertainty. That uncertainty was working in Gold bulls’ favor as the door opened into August, with price action showing considerable strength in the first week of last month. But prices soon found sellers at a fresh all-time-high of 2075, after which the Daily chart put in a bearish engulfing pattern – and matters haven’t really been the same in Gold markets ever since.
That bearish engulfing pattern from three Fridays ago led into a precipitous decline in the opening days of the following week. Since then, Gold prices have largely digested that recent range with price action narrowing through the second-half of August.
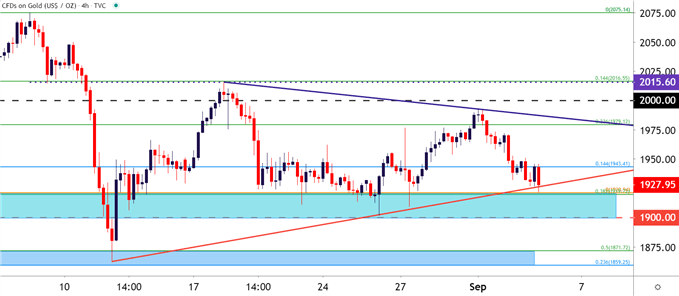
Of interest in that theme was a big zone of support running from 1900-1920 that’s held multiple support tests around the lows. This morning saw yet another support test in that zone, and so far buyers have been able to hold the lows, getting an assist from a bullish trendline projection that can be found by connecting August 11th and 26th swing-lows.
Gold Four-Hour Price Chart

Chart prepared by James Stanley; Gold on Tradingview
Taking a step back on the chart highlights a symmetrical wedge formation that’s built in Gold prices during this recent round of digestion. The support side of that wedge, with an assist from the 1920 level that previously functioned as the all-time-high are helping to currently hold the lows.
And this sets the stage for tomorrow’s NFP report. This is the first such release since Chair Powell’s comments at Jackson Hole, when the head of the FOMC placed even more emphasis on the employment side of the bank’s dual mandate. Complicating matters around tomorrow’s employment numbers is the potential for noise in the data, as a number of temporary hires to complete this year’s census is likely going to show in the numbers; further obscuring actual impact to the economy based on shifts in the employment market over the past month.
Gold Price Daily Chart

Chart prepared by James Stanley; Gold on Tradingview
--- Written by James Stanley, Strategist for DailyFX.com
Contact and follow James on Twitter: @JStanleyFX

