Gold Talking Points:
- Last week saw Gold prices take a heavy hit, and a week later there’s still only been a mild recovery.
- Short-term Gold prices are range-bound, and given the drivers that have pushed the trend and the fact that they may not be in the spotlight until later summer, the potential for ranges in Gold seems high.
Last week saw heavy re-pricing in Gold as buyers bailed after the Fed issued their updated forecasts. And while the changes in the Fed’s forecasts may seem subtle, the market reaction was not as there was a clear signal that was being inferred and perhaps even implied by the FOMC. That signal is that the loose money policies implemented to help the economy round the corner on Covid will not be around forever. And as some economic items have perked up, such as inflation, the end of that accommodation may be coming sooner rather than later.
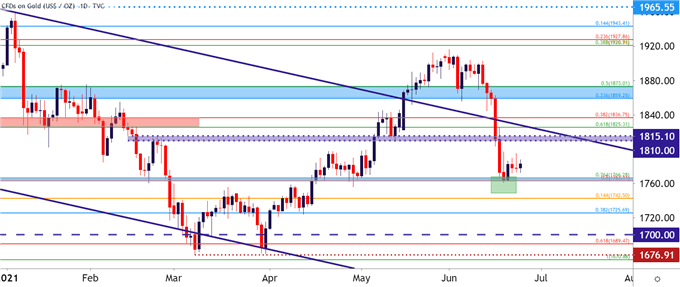
The Fed highlighted the potential for two rate hikes in 2023; so not next year but the year after, and in fast order the US Dollar surged and most major FX pairs reversed. Gold prices were not left unscathed, as buyers quickly bailed from bullish setups and prices sunk all the way down to 1761 after having traded at 1900 on the Friday before the FOMC.
That amounts to a move of -7.46%, taken from the Friday high to last week’s low, and at that point a confluent zone of Fibonacci support started to come into play that, thus far, has been able to contain the lows. This plots between 1763.11 and 1766.28. And after holding last week’s low into this week’s open, prices have put in a mild bounce from this zone and that’s so far held up throughout the week.
To learn more about Fibonacci, check out DailyFX Education
Gold Daily Price Chart

Chart prepared by James Stanley; Gold on Tradingview
Gold Bounce Cut Short So Far
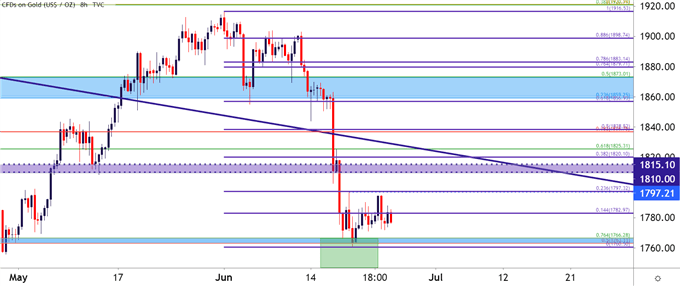
Normally after a move of that magnitude, once support plays in there’s often a stronger pullback in response. Take the US Dollar, for instance, which put in a very visible pullback in the first few days of this week. But in Gold, sellers have remained fairly active while helping to drive-in resistance just inside of the 1800 handle. And the corresponding bounce from support? That’s only retraced 23.6% of the June move whereas the US Dollar had retraced a bit more.
The highlight here is the fact that the pullback in the Gold sell-off has been a bit lighter than the pullback in the USD surge, and this indicates that there may be a greater shift afoot as investors gear up for a more hawkish Fed at some point down the road, even if that’s not a near-term concern.
Gold Eight-Hour Price Chart

Chart prepared by James Stanley; Gold on Tradingview
Gold Strategy Near-Term: A Range Has Developed
So, setting the stage on the longer-term backdrop leads to a shorter-term setup. That longer-term backdrop is one of patience and waiting: The Fed has said their piece and furnished their projections and we’re not due for another quarterly meeting until September. But, along the way we’ll get the Jackson Hole Economic Symposium and this seems to be where many are expecting to hear that next big announcement out of the FOMC, particularly on the topic of taper and what their plans are there.
This means that there’s a couple of months of open road. Gold had previously held a bullish backdrop after having broken-above the bull flag in the month of May. But, after last week’s reversal on a more-hawkish Fed, the stage appears to be setting up for possible bearish trends should the FOMC continue to step closer and closer towards policy normalization.
But, again, these are items that are expected to be a couple of months away.
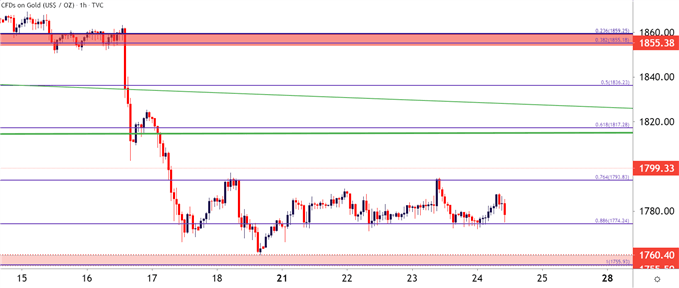
For now – Gold prices have started to build into a minor range after last week’s major move. This range is extremely tight so it may not hold for too long, but there’s been a couple of inflections at each side of support and resistance at this point and this is something that can keep the backdrop open for some range continuation items.
Guiding that range along is a Fibonacci retracement produced by the major move spanning from the April 29 low up to the June 1 high. Range support is showing around the 88.6% retracement of that major move, plotted at 1774.24; while resistance is showing around the 76.4% retracement at 1793.83. The hourly chart below highlights this dynamic, and for those that are carrying a bullish or bearish bias, looking for trends to develop – they can essentially approach the range with a trend-side bias.
Gold Hourly Price Chart

Chart prepared by James Stanley; Gold on Tradingview
--- Written by James Stanley, Senior Strategist for DailyFX.com
Contact and follow James on Twitter: @JStanleyFX


