Euro, EUR/USD, US Treasury Yields, ECB, Federal Reserve – Talking Points:
- Equity markets lost ground during APAC trade as investors turn their attention to the upcoming US earnings season.
- Upcoming US inflation figures may intensify Fed tapering bets and undermine EUR/USD.
- Bullish technicals on the weekly and daily timeframe hint at further gains for EUR/USD rates.
The Quiz
Discover what kind of forex trader you are
Asia-Pacific Recap
Equity markets slipped lower during Asia-Pacific trade as investors look ahead to the start of the US earnings season this week. Australia’s ASX 200 fell 0.38%, Hong Kong’s Hang Seng Index dropped 0.98%, and Japan’s Nikkei 225 dipped 0.64%. China’s CSI 300 plunged 1.6% as policy tightening fears continued to weigh on regional risk assets.
In FX markets, the cyclically-sensitive AUD and CAD largely underperformed, while the haven-associated USD and JPY gained ground against their major counterparts. Gold prices drifted lower despite yields on US 10-year Treasuries sliding back below 1.66%, as Greenback strength weighed on the anti-fiat metal. Crude oil prices fell back to $59 per barrel. Looking ahead, retail sales figures out of the Euro-zone headline a rather light economic docket.

US Inflation Figures to Undermine EUR/USD
As mentioned in previous reports, the divergence in fundamentals between the European Union and United States, and the differing outlooks on the path forward for monetary policy between the Federal Reserve and European Central Bank, may cut short the Euro’s recent recovery against the Greenback.
It is no secret that the Euro-zone has struggled to combat the coronavirus pandemic, with several nations notably tightening restrictions in recent weeks as the rollout of vaccines continues to travel at a snail’s pace. Only 15% of the trading bloc’s population has received at least one dose of a Covid-19 vaccine, vastly less than the 35% of Americans who have been inoculated.
Indeed, the US is on track to vaccinate 75% of the population – the amount needed to achieve herd immunity – within the next three months, if the current immunisation rate remains steady.
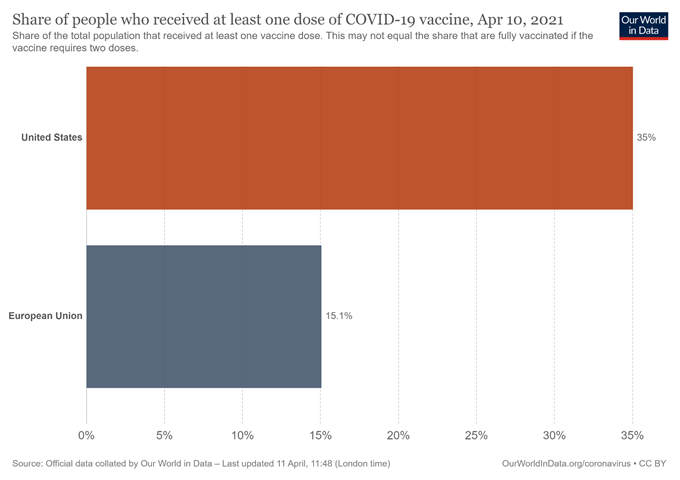
Upcoming economic data may also reinforce US outperformance when compared to the EU and put a premium on the Greenback against the Euro, as attention turns to inflation and retail sales figures for the month of March. Base effects are expected to result in a series of strong data prints, which in tandem with a fresh supply of longer-term Treasuries, will probably drive yields higher.
These dynamics in combination with the German Constitutional Court preventing President Steinmeier from ratifying the European Recovery Fund, and the ECB upping its pace of weekly bond purchases, probably widens the yield spread between German Bunds and US Treasuries.
With that in mind, the EUR/USD exchange rate may reverse lower in the week ahead, despite last week’s relatively bullish price action.
EUR/USD Weekly Chart – Bullish Engulfing Candle to Inspire Recovery?
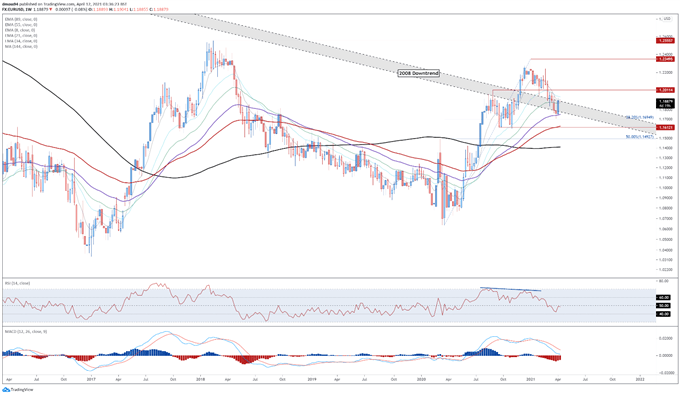
Chart prepared by Daniel Moss, created with Tradingview
A Bullish Engulfing candle formation on the weekly chart suggests that EUR/USD rates may be poised to resume the uptrend extending from the March 2020 nadir.
With price tracking above the trend-defining 55-EMA (1.1941), and the MACD continuing track above its neutral midpoint, the path of least resistance seems higher.
However, with the RSI dipping below 50 and price tracking below the short-term moving averages, a more extended decline could be in the offing.
Failing to gain a firm foothold above 1.1900 on a weekly close basis probably opens the door for sellers to drive the exchange rate back towards the 38.2% Fibonacci (1.1695).
On the other hand, bursting back above 1.1900 could ignite a push to challenge the August high (1.2011), with a break above needed to bring the yearly high (1.2349) into focus.
EUR/USD Daily Chart – 55-EMA Capping Upside Potential
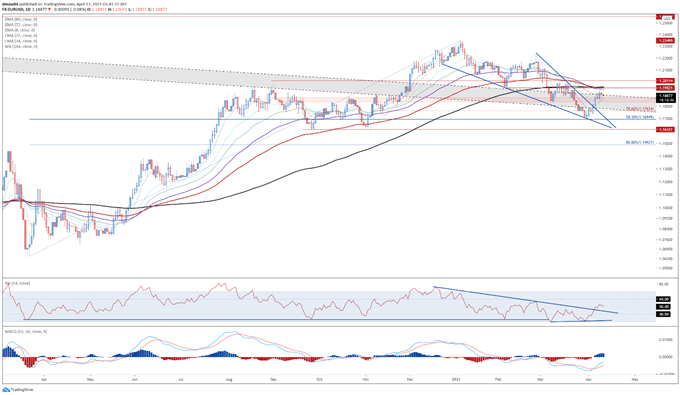
Chart prepared by Daniel Moss, created with Tradingview
The daily chart also paints a reasonably bullish picture for EUR/USD, as prices break out of a bullish Falling Wedge pattern and burst back above the 8-EMA (1.1860).
Indeed, with the RSI snapping the downtrend extending from the yearly highs, and a bullish crossover taking place on the MACD, further gains appear in the offing.
That being said, with price still hovering below all three longer-term moving averages, an extended push higher seems relatively unlikely.
Therefore, if resistance at 1.1950-1.2000 holds firm, a sharp reversal back towards the monthly low (1.1704) could be on the cards.
Alternatively, a convincing break back above the sentiment-defining 144-EMA (1.1960) may intensify buying pressure and bring the February high (1.2243) into the fray.
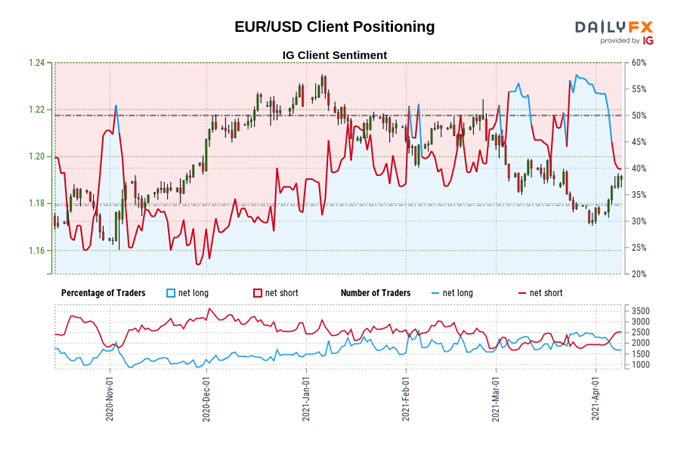
The IG Client Sentiment Report shows 40.13% of traders are net-long with the ratio of traders short to long at 1.49 to 1. The number of traders net-long is 2.94% lower than yesterday and 28.13% lower from last week, while the number of traders net-short is 2.11% lower than yesterday and 26.17% higher from last week.
We typically take a contrarian view to crowd sentiment, and the fact traders are net-short suggests EUR/USD prices may continue to rise.
Traders are further net-short than yesterday and last week, and the combination of current sentiment and recent changes gives us a stronger EUR/USD-bullish contrarian trading bias.
-- Written by Daniel Moss, Analyst for DailyFX
Follow me on Twitter @DanielGMoss


