Euro Talking Points:
- It’s an ECB day and the bank made another increase to their stimulus program this morning. For full details, check out the ECB write-up from our own, Mr. Justin McQueen.
- EUR/USD pushed up to find resistance again at a key Fibonacci level on the heels of this morning’s statement/press conference.
- The analysis contained in article relies on price action and chart formations. To learn more about price action or chart patterns, check out our DailyFX Education section.
This morning marked the announcement of the December ECB rate decision and there was little surprise as the European Central Bank extended their QE program, as was widely-expected. As discussed by Justin McQueen earlier this morning, the single currency rose on the announcement, hinting that what was announced was already well priced-in ahead of time.
EUR/USD is currently encountering a long-term resistance zone that came into play last week after the pair broke above the 1.2000 psychological level. That same 1.2000 level produced a strong resistance reaction in early-September, but upon re-approach, bears could hold the pair back no longer as buyers pushed up to a fresh two-year-high at 1.2178.
But, that’s around the time that this confluent resistance zone began to bring sellers into the picture, and ahead of the ECB rate decision this week, the pair held a series of short-term lower-lows as market participants readied for the rate decision, gearing up for a possible surprise that obviously did not happen.
To learn more about how Central Bank Intervention Impacts the Forex Market, join us in DailyFX Education
EUR/USD Four-Hour Price Chart
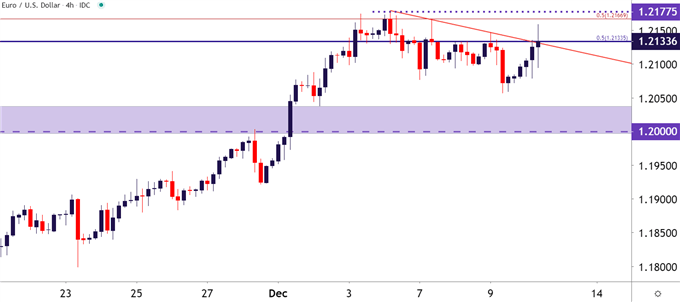
Chart prepared by James Stanley; EUR/USD on Tradingview
The big question at this point is whether the shot of volatility that showed up in the pair this morning might be able to stick around. Taking a shorter-term look at the matter, bulls are getting a bit more aggressive after this morning’s announcement, helping to produce a series of short-term higher-highs as price action has scaled back into this resistance zone.
Of note – the price of 1.2167 is the 50% marker of the 2008-2017 major move, while 1.2134 is the 50% marker of the longer-term 2000-2008 move in EUR/USD.
Taking a shorter-term look at the matter, and we can see where this morning’s higher-high has already begun to pullback – and the big question is whether buyers show up to offer higher-low support, keeping the door open for a test of the recently-set two-year-high.
EUR/USD Hourly Price Chart
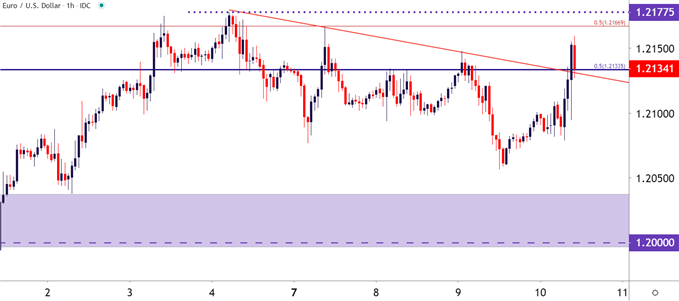
Chart prepared by James Stanley; EUR/USD on Tradingview
EUR/JPY Touches Up to Fresh Three-Month-High
For those that are looking for bullish Euro strategies, EUR/JPY may offer a more encouraging chart for such an approach taken from the fact that the pair did touch up to a fresh three-month-high this morning.
There is some longer-term resistance in the pair, however, generating from a trendline connecting the 2014 and 2018 swing-highs.
To learn more about trendlines, join us in DailyFX Education
EUR/JPY Monthly Price Chart
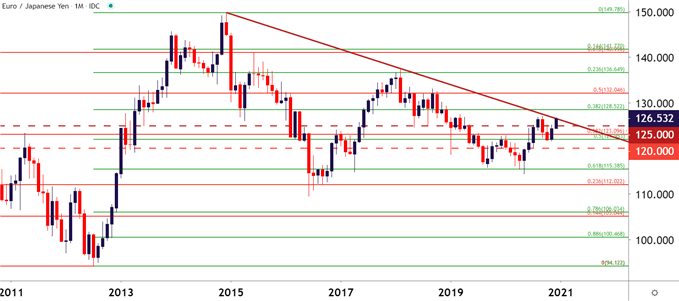
Chart prepared by James Stanley; EUR/JPY on Tradingview
This trendline re-entered the equation on December 2nd, and has elicted some form of resistance on five of the past six trading days, highlighting the bullish effort to take out resistance on the way to fresh highs.
The current yearly high sits just above, around 127.08; and that becomes the next level of interest should buyers retain control, after which fresh yearly highs come into the equation.
EUR/JPY Daily Price Chart: Long-Term Trendline In-Play
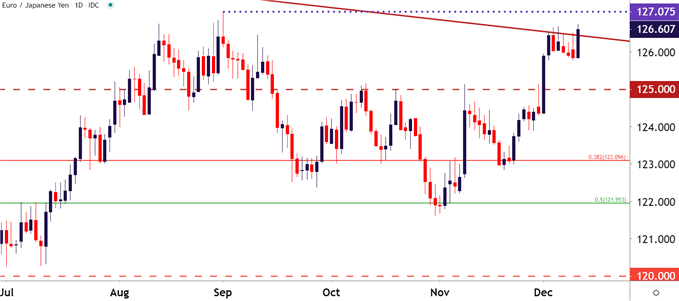
Chart prepared by James Stanley; EUR/JPY on Tradingview
--- Written by James Stanley, Strategist for DailyFX.com
Contact and follow James on Twitter: @JStanleyFX


