EU Stoxx 50, European Central Bank, Inflation, Monetary Policy – Talking Points:
- The EU Stoxx 50 index may continue to grind lower amid rising cases of Covid-19
- The European Central Bank’s September meeting could determine the outlook for European equity prices
Asia-Pacific Recap
The haven-associated Japanese Yen clawed back lost ground against its major counterparts during Asia-Pacific trade, while the US Dollar continued to slide lower.
Positive vaccine news buoyed equity markets as the S&P 500 index trudged back towards its record high. Gold held steady alongside Treasury yields, whilst silver dipped 0.1%.
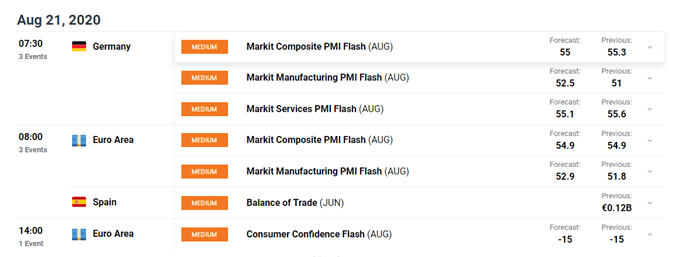
Looking ahead, manufacturing PMI data out of Germany, France, the UK and Euro-zone headline the economic docket and may prove market-moving.

ECB Uncertainty Weighing on Risk Assets
The minutes from the European Central Bank’s July monetary policy session showed that the central bank remained relatively uncertain over the trading bloc’s economic outlook, as committee members agreed that “at its September meeting the Governing Council would be in a better position to reassess the monetary policy stance and its policy tools”.
Opting to wait for “additional information, including more hard data releases, new staff projections and news on fiscal measures” suggests that the ECB is extremely cognizant of rolling back stimulus measures prematurely, despite Chief Economist Philip Lane’s assessment that “incoming data and survey results suggest that economic activity had improved significantly in May and June”.
In fact, Lane emphasized that “although economic activity was gaining momentum, there was no room for complacency” as he warned that “any premature tightening of financial conditions could put the ongoing recovery at risk”.
EU Mobility Trends (YTD)

Source – Apple Mobility
Therefore, the central bank’s commitment to “do everything necessary within its mandate [and] adjust all of its instruments as appropriate” should underpin regional equity markets moving forward.
However, the suggestion by some committee members that “the flexibility of the pandemic emergency purchase programme suggested that the net purchase envelope should be considered a ceiling rather than a target” could stoke concerns that the ECB won’t fully deploy the €1.35 trillion.
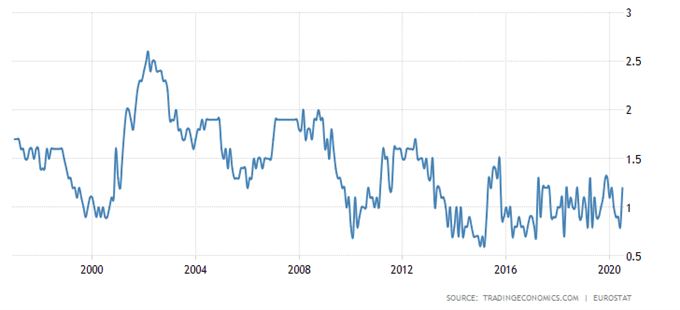
This seems highly unlikely however, considering consumer prices in the Euro-zone fell 0.4% month-over-month in July – the largest drop since January – and a ‘second wave’ of Covid-19 infections in Germany, France, Spain and Italy, threatens to derail the EU's nascent economic recovery. High-frequency data displays a notable drop off in activity during August, reflecting the impact of the recent surge in case numbers.
Nevertheless, the absence of more aggressive forward guidance may weigh on regional asset prices ahead of the ECB’s monetary policy meeting in September, as investors’ mull upcoming economic data to determine the central bank’s next steps.
Euro-zone Core Inflation Rate

Source - TradingEconomics
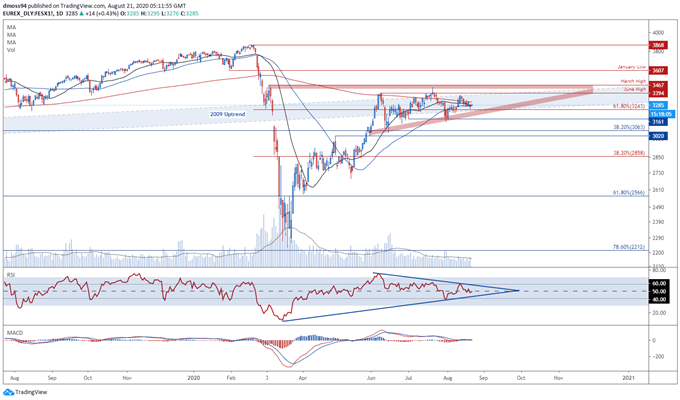
EU Stoxx 50 Index Daily Chart – Coiling Up Above Key Fibonacci Support
Europe’s EU Stoxx 50 index’s failed attempt to breach key resistance at the June high (3394) seemed to ignite the recent pullback to 61.8% Fibonacci support (3243) and the trend-defining 50-day moving average (3270).
This slide lower appears to have set the stage for a push to fresh post-crisis highs, as price carves out an Ascending Triangle pattern just shy of psychological resistance at the 3400 level.
A break of resistance at the March high (3467) would probably validate the bullish continuation pattern and could see the European benchmark climb to fresh record highs if it successfully fulfils the implied measured move (3870).
The RSI may provide the initial trigger for would-be buyers if it snaps its downtrend from the extremes seen in June, with a marked increase in volume needed to confirm a potential breakout.
On the other hand, a daily close below the 61.8% Fibonacci (3243) could generate a wave of selling pressure and clear a path back towards the June low (3046).
However, with the MACD indicator hovering above 0 and price continuing to set a series of higher lows, the path of least resistance remains tilted to the upside.

EU Stoxx 50 Index daily chart created using TradingView
-- Written by Daniel Moss, Analyst for DailyFX
Follow me on Twitter @DanielGMoss


