Dow, S&P 500, Nasdaq 100 Price Analysis
- US equities popped-higher today, with a 7% gain in the S&P 500 and a 7.7% move in the Dow.
- At the source of the move was hope that there may be a slowing in the growth rates of the novel coronavirus in hotspots in Europe and the United States.
- Last month brought a brutal rally into the equation; but this was met by some significant economic drivers out of both Congress and the Fed.
US Stocks Rise as Hope Populates the Horizon
After a very pessimistic backdrop engulfed the economic world in the month of March, a bit of hope has populated the horizon around the April open. US equities put in a big day on Wall Street, virtually speaking, as much of Wall Street is working from home.
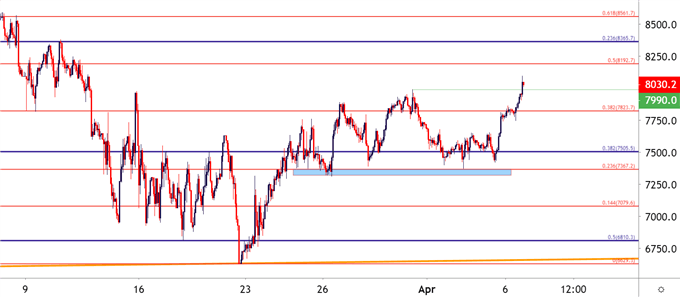
The Dow Jones Industrial Average was up by 7.73% while the S&P 500 was up by 7.03%. The Nasdaq 100 also had a big day, pushing above the 8k marker as prices in all three indices crafted fresh three-week-highs.
On the driver side of the matter – hope permeates the backdrop as the epicenter of the novel coronavirus, in New York City, has started to see some evidence of new cases leveling out. This provides hope that the city may soon be nearing or, may have already crossed an apex in the ordeal around the global pandemic that’s caused shutdowns and stay-at-home orders across the United States. While this recent positivity in the data doesn’t necessarily indicate that the saga is yet over, it does provide some light at the end of a tunnel that until today has been very, very dark.
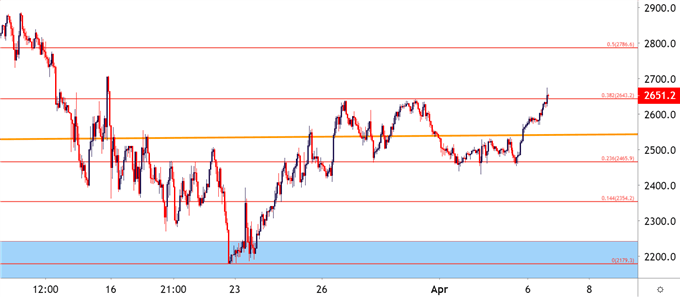
In the S&P 500, price action jumped above a huge level at 2643, which is the 38.2% retracement of the February-March sell-off. This price had twice rebuked bulls in the two weeks prior. Also encouraging – the index held support fairly well around the 23.6% retracement of that same major move last week, helping to cauterize some higher-low support after an aggressive sell-off pushed the S&P 500 from fresh all-time-highs in late-February to fresh three-year-lows in mid-March.
S&P 500 Hourly Price Chart

Chart prepared by James Stanley; SPX500 on Tradingview
Dow Jones Crosses Key Confluent Zone
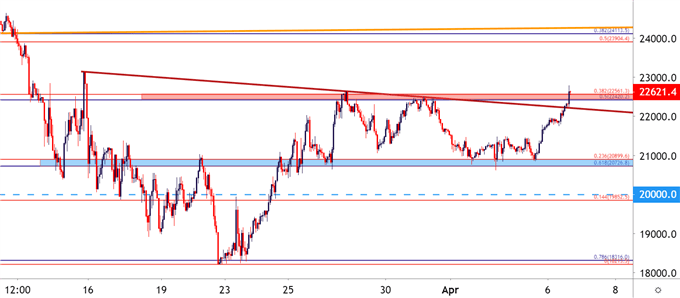
It was a similarly strong day in the Dow with prices pushing up to fresh three-week-highs. As discussed previously, the Dow had taken a deeper turn with this recent round of risk aversion, and even into this week the index had held resistance below a bearish trend-line connecting the swing-highs over the past few weeks. But today’s bullish move saw the Dow take out a key area of confluent Fibonacci levels, running from 22420-22561.
Dow Jones Hourly Price Chart

Chart prepared by James Stanley; Dow Jones on Tradingview
Nasdaq 100 Blasts Off, Crosses 8K Marker
As looked at in previous webinars, the Nasdaq 100 held up a bit better than both the S&P 500 and the Dow in this recent round of risk aversion. And with this recent bullish move, the index has crossed the 8k marker as a pronounced breakout has shown on short-term charts.
Nasdaq 100 Hourly Price Chart

Chart prepared by James Stanley; Nasdaq 100 on Tradingview
--- Written by James Stanley, Strategist for DailyFX.com
Contact and follow James on Twitter: @JStanleyFX


