Dow, S&P 500, Nasdaq 100 Price Analysis
- It was a brutal month of March and the outlook for economic data is not bright as recessionary concerns have continued to grow as the novel coronavirus has continued to spread.
- Global Central Banks, especially the Federal Reserve, have been extremely busy over the past month in an attempt to stem the pressure from growing fears of an impending recession.
- The Dow Jones Industrial Average sold off by as much as 38.4% from the February high to the March low, while the S&P 500 lost as much as 35.9% over the same observed period. The tech-heavy Nasdaq 100 was relatively tame by comparison, with the max drawdown over that same observation showing at 32%. This can help to denominate strategy in US equities ahead of the Q2 open.
Stocks Recover a Bit– but Limp into Q2
The final tallies are almost in as a brutal month of March nears its end. A bit of hope has developed in risk markets as US equities grasp on to recent gains, holding in patterns that could potentially keep the door open for bullish scenarios. But a plethora of uncertainty remains in the weeks and months ahead, with April expected to be especially brutal in the headlines as the novel coronavirus continues to spread and a number of economic consequences remaining unaddressed as the world simply tries to stem contagion from the virus.
What we know at this point: April is likely going to be an ugly month across the United States and that statement can likely be spanned globally. We may hopefully hit a peak in the number of new infected cases but given the geographic dispersion in the United States and the way that the virus has already taken hold, that peak may not show up until sometime in May. This is likely to further compel economic slowdowns putting a number of question marks behind Q2 growth metrics. We’ve already started to see this filter into the data and that won’t get any prettier anytime soon.
However – the other side of the matter has some argument, as well, as global Central Banks, particularly the Federal Reserve, have been extremely busy of late, launching a historic amount of stimulus aimed directly at stemming the effects of the coronavirus-driven slowdowns.
In the S&P 500, the month of March closes with a bit of hope as a short-term formation points to the potential for further gains. And, it’s now been a full week since we’ve seen S&P 500 futures go ‘limit down,’ so, there’s some hope that the worst may be over in equity markets. But hope can be a dangerous thing, particularly when one finds themselves in the middle of a global pandemic; and the rally over the past week can be easily explainable as a ‘bear market bounce’ as month and quarter-end flows compel short cover.
Price action in the S&P 500 is currently finding resistance at the 38.2% Fibonacci retracement of the recent sell-off. This can keep the door open for bearish swing strategies, which is the opposite side of what can be gleamed from shorter-term observations as looked at below.
S&P 500 Weekly Price Chart
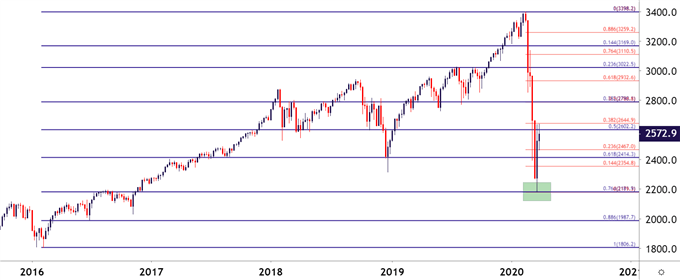
Chart prepared by James Stanley; SPX500 on Tradingview
On a shorter-term basis, that resistance has been in-play since last Thursday when buyers shied away from a re-test, quickly coming back into play this week. But – of interest on the long side of the matter is the fact that resistance reactions have been growing weaker with each recurrent test – highlighting the potential for bullish breakout scenarios. This takes on the form of an ascending triangle, which will often look for the horizontal resistance to get taken out as burgeoning bullish demand takes control of near-term price action.
S&P 500 Two-Hour Price Chart
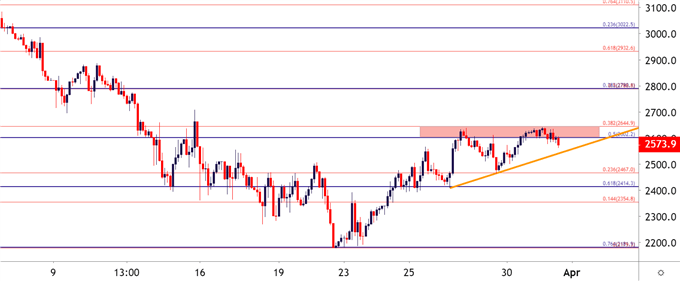
Chart prepared by James Stanley; SPX500 on Tradingview
Nasdaq 100 – Shallower Sell-Off
I know a number of traders and investors were looking at the initial phase of this sell-off opportunistically, trying to make relative value plays in pristine tech names like Apple or Netflix – stocks that had run so high during the bull rally that entry became a monstrous challenge.
But – like most equities, even the pristine tech names couldn’t avoid the sell-off and the Nasdaq similarly took a hit last month. Of note, however, is the shallower hit that had shown in the Nasdaq 100 versus the S&P 500 or even the Dow Jones Industrial Average; and this is despite the fact that tech stocks usually trade as ‘high beta’ issues that are generally more volatile, in either direction as new items get priced in.
But – case in point – the recent sell-off in the S&P 500 saw prices pullback to the 76.4% retracement of the 2016-2020 major move. In the Nasdaq 100 – the move was far shallower, as the 50% retracement of the same measured move came into play to help set support. This highlights how the tech-heavy Nasdaq 100 had a lessened bearish response even with the same stimuli than the S&P 500. This also highlights how bullish US equity plays may be more attractive here than elsewhere such as the S&P 500 or the Dow Jones Industrial Avearge.
Nasdaq 100 Weekly Price Chart
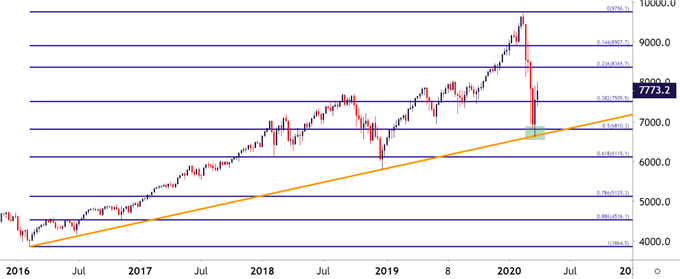
Chart prepared by James Stanley; Nasdaq 100 on Tradingview
The shorter-term setup in the Nasdaq 100 is similar to the above scenario looked at in the S&P 500, with the exception of the fact that buyers have been tip-toeing up to higher-highs earlier today. So, while the S&P 500 is currently restrained by the 38.2% retracement of the recent sell-off, the Nasdaq 100 has started to test above this level whilst also establish some higher-low support, making it as a potentially more attractive candidate for US equity strength plays heading into Q2.
Nasdaq 100 Four-Hour Price Chart
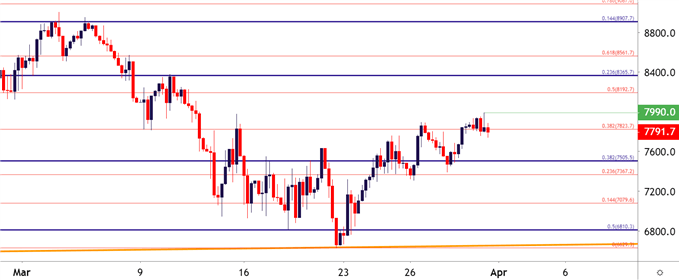
Chart prepared by James Stanley; Nasdaq 100 on Tradingview
Dow Takes the Biggest Hit as Boeing Remains a Sore Spot
It was an especially brutal month for the United States largest exporter of Boeing and, to be sure, coronavirus-driven slowdowns aren’t the only bearish factor working against the stock. There’s also the fear of pending litigation from the 737 Max scenario which had kept the stock on its back foot coming into 2020, with a fresh yearly low printing in January even as US equity indices tore-away to fresh all-time-highs at the time.
While the S&P 500 retraced as much as 76.4% of that 2016-2020 major move, the Dow retraced 78.6% of the 2015-2020 major move. The 50% marker of that same Fibonacci study is currently helping to set resistance, which is confluent with the 38.2% retracement of the recent sell-off.
Collectively, this can make the Dow Jones Industrial Average as the more vulnerable of the three major US equity indices; and for traders looking at bearish scenarios to come back into play in Q2, the Dow may hold more allure than both the more broad-based S&P 500 as well as the tech-heavy Nasdaq 100.
Dow Jones Industrial Average Four-Hour Price Chart
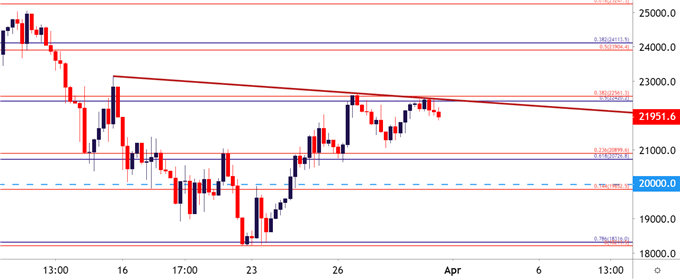
Chart prepared by James Stanley; Dow Jones on Tradingview
--- Written by James Stanley, Strategist for DailyFX.com
Contact and follow James on Twitter: @JStanleyFX

