Dow Jones, Russell 2000, Federal Reserve, Coronavirus-Relief Package, Inflation – Talking Points:
- The Federal Reserve’s commitment to loose monetary policy conditions will likely underpin US equity markets.
- Dow Jones is eyeing a push to challenge 33,000 after clearing key resistance.
- Bull Flag continuation pattern hints at extended gains for the Russell 2000.
Asia-Pacific Recap
Equity markets pushed higher during Asia-Pacific trade, as the Federal Reserve Chairman Jerome Powell reiterated the central bank’s accommodative monetary policy stance. Australia’s ASX 200 climbed 0.83%, Japan’s Nikkei 225 rose 1.67% and Hong Kong’s Hang Seng Index surged 1.75%.
In FX markets, the commodity-sensitive CAD and NOK largely outperformed on the back of resilient oil prices, while the haven-associated JPY lost ground against its major counterparts. Gold and silver prices dipped lower as yields on US 10-year Treasuries jumped just under 3 basis points higher.
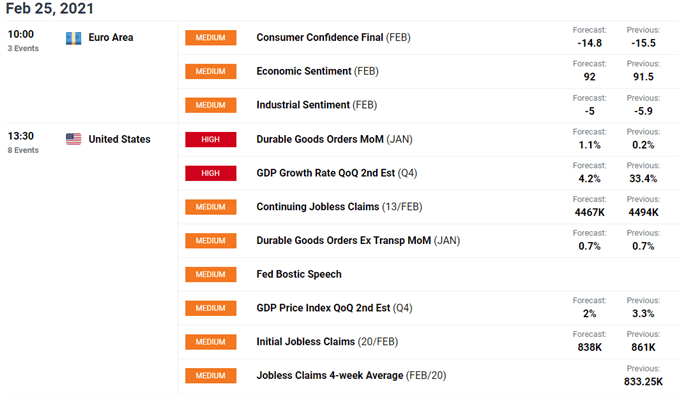
Looking ahead, US Q4 GDP figures and durable goods orders for January headline the economic docket alongside consumer confidence figures out of the Euro-area.

Accommodative Fed, Fiscal Stimulus to Underpin US Equities
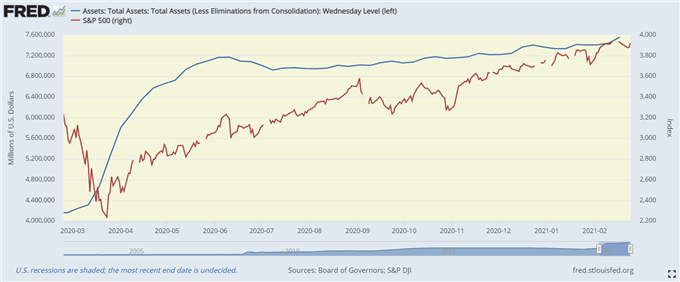
As mentioned in previous reports, the Federal Reserve’s accommodative monetary policy stance, and the impending provision of additional fiscal support, will probably buoy US equity markets in the coming weeks.
In the Fed’s semi-annual monetary policy testimony before Congress, Chairman Jerome Powell reiterated that “the economy is a long way from our employment and inflation goals, and therefore the central bank will maintain its loose approach to monetary policy until “substantial further progress has been made” towards achieving its two mandated goals.
Powell also seemed unperturbed by the recent rise in inflation expectations, stating that “inflation dynamics do change over time but they don’t change on a dime, and so we don’t really see how a burst of fiscal support or spending that doesn’t last for years would actually change those inflation dynamics”.

He also stated that it will take more than a sustained drop in the unemployment rate to reassure the central bank that the labor market has recovered to pre-pandemic levels, stressing that “when we say maximum employment, we don’t just mean the unemployment rate, we mean the employment rate”.
The current unemployment rate stands at 6.3%, sharply higher that its pre-crisis low of 3.5%, while the percentage of Americans employed has plunged from 61% before the pandemic, to 57.5%. With that in mind, it appears that accommodative monetary policy settings are here to stay for the foreseeable future, which will likely pave the way for the Dow Jones and Russell 2000 indices to continue gaining ground.
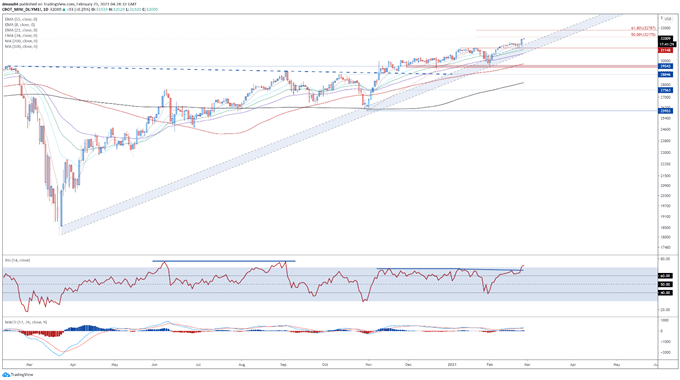
Dow Jones Futures Daily Chart – 33,000 Mark Within Striking Distance

Dow Jones futures daily chart created using Tradingview
From a technical perspective, the Dow Jones looks poised to extend it recent surge above resistance at the February 16 high (31662), as price accelerates away from the 8-EMA.
With the RSI surging into overbought territory, and the MACD tracking firmly above its neutral midpoint, the path of least resistance seems higher.
A daily close above the 50% Fibonacci (32170) would probably intensify near-term buying pressure and bring the psychologically imposing 33000 mark into focus.
Alternatively, failing to hurdle 32000 could ignite a counter-trend pullback to the 21-day exponential moving average (31284) and the uptrend range extending from the March 2020 nadir.
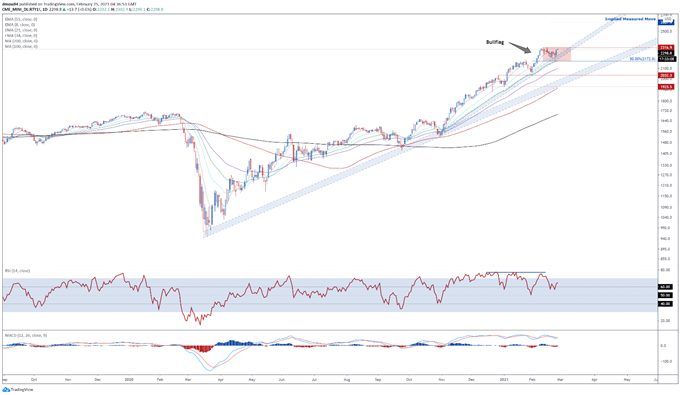
Russell 2000 Futures Daily Chart – Bull Flag Pattern Hints at Extended Gains

Russell 2000 futures daily chart created using Tradingview
The formation of a Bull Flag continuation pattern just below key resistance at 2300 suggests that the Russell 2000 is poised to push significantly higher in the near term, if buyers can convincingly break above the monthly high (2317).
Bullish MA stacking, in tandem with both the RSI and MACD tracking above their respective neutral midpoints, is indicative of swelling buying momentum.
A daily close above 2320 is needed to validate the bullish continuation pattern and open the door for price to challenge psychological resistance at 2500. The Bull Flag’s implied measured move suggesting the index could climb an additional 13.3% from current levels to challenge the 2600 mark.
However, a break below the 50% Fibonacci (2173) would invalidate the pattern and possibly generate a downside push towards the trend-defining 55-EMA (2099).
-- Written by Daniel Moss, Analyst for DailyFX
Follow me on Twitter @DanielGMoss

