Dow Jones, Nasdaq 100 Price Forecast:
- US equities continue to show hues of recovery from the early-September slump.
- Tomorrow’s economic calendar is loaded – with heavy emphasis on the FOMC rate decision.
- The analysis in this article heavily utilizes price action and chart patterns. To learn more about price action, check out our DailyFX Education section, where it’s taught amongst a host of other candlestick patterns and formations.
Stocks Hold Support, Fed on the Way
Tomorrow brings the next installment of the Federal Reserve’s tangle with the coronavirus and related effects. The big item out of the Fed in August was the commentary from Jerome Powell to kick off the Jackson Hole Economic Symposium, in which the head of the FOMC shared the bank’s strategy shift. While the Fed maintains a dual mandate, marked with monitoring both inflation and employment, the FOMC is now taking a more watchful eye towards employment while being a bit more passive with inflationary pressure, should it show. While the bank has long targeted 2% inflation, the bank will now target ‘average inflation,’ with a bit more subjectivity in rate policy should inflation near that 2% number.
Given the blistering trends seen through the summer, one might imagine that such a shift would prod the topside of stocks to further fresh highs. And while the initial announcement did give a quick bit of run in the immediate aftermath, the September open has ushered in a different backdrop and US equities are currently lower than they were when Powell made that proclamation.
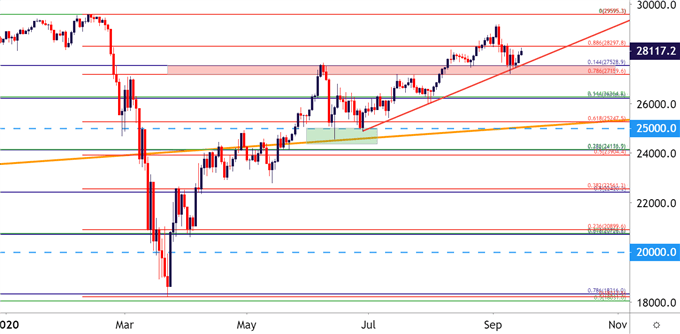
The high-flying Nasdaq 100 appeared to get hit the hardest, with the Dow Jones Industrial Average sinking down to a zone of potential support as taken from prior resistance. This zone also offers a bit of confluence, as a trendline projection intersects this area on the chart, which spans between two Fibonacci levels of interest at 27,160 and 27,529.
Dow Jones Daily Price Chart

Chart prepared by James Stanley; Dow Jones on Tradingview
When I had looked at support potential across the major US indices a couple of weeks ago, the above zone was marked in the Dow Jones Industrial Average. What hadn’t yet appeared was the zone of support currently helping to hold the lows in the Nasdaq.
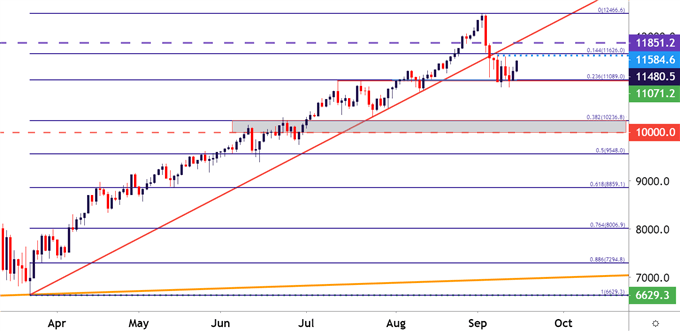
In the Nasdaq 100, a spot of support around the 11k area has helped to hold the lows for a week now; and this comes in around the 23.6% retracement of the March-September major move. Near-term resistance appears around the 11,584-11,626 area, which has held the highs of recent, and if buyers are able to burst above, the possibility of fresh new highs will likely look a lot more attractive. If, on the other hand, sellers take control, the 38.2% retracement of that same major move, plotted down to the 10k level on the chart can be an attractive spot to seek out that next bit of support.
Nasdaq 100 Daily Price Chart

Chart prepared by James Stanley; Nasdaq 100 on Tradingview
--- Written by James Stanley, Strategist for DailyFX.com
Contact and follow James on Twitter: @JStanleyFX


