Canadian Dollar, CAD, USD/CAD, Loonie Price Analysis
- After an outsized rush of volatility in the first two-and-a-half months of the year, USD/CAD price action has calmed into a range-bound backdrop.
- While mean reversion has been the theme over the past few weeks, that may not last for long as Friday’s economic calendar brings employment reports out of both the United States and Canada – producing the potential for heavy volatility in USD/CAD.
USD/CAD: From Resistance to Support and Back
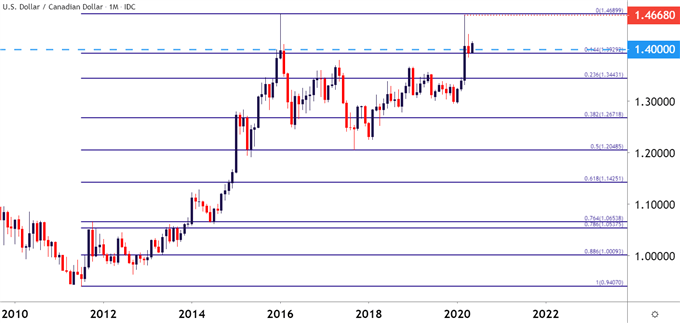
As looked at last week, USD/CAD was holding resistance around the psychological level of 1.4000 on the chart, and this has previously been a big level in the pair as there’s been but a couple of months in which the pair has traded above this level over the past 15 years. Notably, this level came into play in January of 2016 after a bullish trend that was almost five years and 5,000 pips in the making ran into a brick wall of resistance. January of 2016 produced an inverted hammer on the monthly chart; and February saw follow-through as sellers continued to push – and for almost four full years price action in USD/CAD remained subdued below the 1.4000 level. Until March of 2020, that is.
USD/CAD Monthly Price Chart

Chart prepared by James Stanley; USDCAD on Tradingview
The month of March brought a flurry of themes to the fray, key of which was fear emanating from near-global shutdowns in response to the spread of the novel coronavirus. This amounted to a strong topside push in the US Dollar as capital flows sought out safer harbors, and US Dollar price action jumped by as much as 8.8% from the March lows up to the March highs – in the span of about ten days as the world ducked for cover.
In USD/CAD – that move in the Greenback was exacerbated by CAD weakness, with the USD/CAD pair rising by as much as 10.2% in the month of March – and jumping above the 1.4000 level in the process. The psychological big figure could not deter bulls at the time as price action ran all the way up to a fresh four-year-high at the 1.4668 level, with buyers shying away from the 17-year-high that lurks just 21 pips above that price.
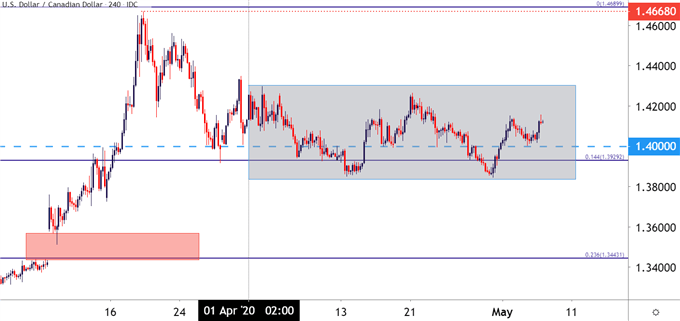
Since then, however, buyers have been unable to re-gain control and after a pullback saw prices claw back a chunk of that prior gain in the first-half of April, price action has moved into a more range-bound state.
USD/CAD Four-Hour Price Chart

Chart prepared by James Stanley; USDCAD on Tradingview
At this point, price action is finding resistance at a familiar level around 1.4150, as this is near the 38.2% retracement of that major move from March and the same level that helped to hold resistance earlier this week. This Fibonacci level is also related to the 1.3992 level that I had looked at last week, which is the 50% marker of that same major move and had previously helped to set some confluent resistance ahead of another support test last week.
That prior resistance zone, comprising approximately 20 pips around the 1.4000 big figure has now been re-purposed as support, helping to cauterize yesterday’s lows ahead of today’s reversion to resistance.
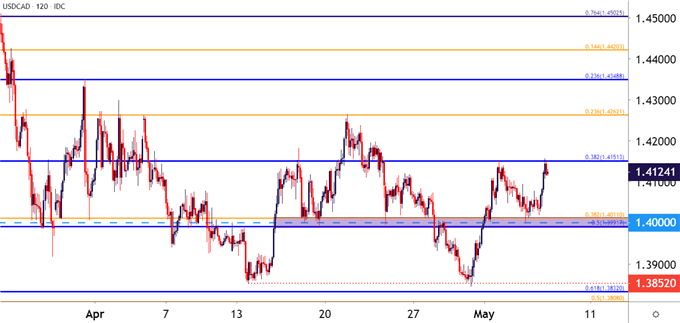
USD/CAD Two-Hour Price Chart

Chart prepared by James Stanley; USDCAD on Tradingview
With a heavy batch of headline risk on the cards for Friday of this week, trends can be a difficult backdrop to investigate as a couple of very key drivers will soon be priced into the equation. The levels nearby price action, however, could be used to help substantiate strategy on the pair; and Fibonacci retracements around both the 2020 major move and the March major move have appeared to offer some interesting levels to work with of recent.
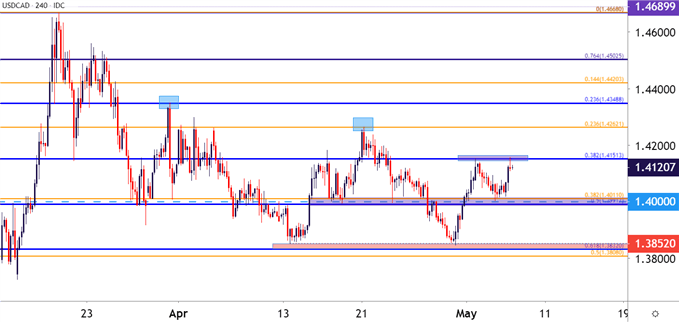
Above current price action is the April high, showing around the 23.6% retracement of the 2020 major move at the 1.4261 level; and above that is the 23.6% retracement of the March major move which had previously helped to set resistance on the final trading day of March.
On the support side of the matter – the confluent zone around the 1.4000 big figure looms large and has been quite busy of recent, helping to set resistance last week followed by support this week; and below that is the 1.3850 level which has helped to extinguish two separate bearish runs in the month of April.
USD/CAD Four-Hour Price Chart

Chart prepared by James Stanley; USDCAD on Tradingview
--- Written by James Stanley, Strategist for DailyFX.com
Contact and follow James on Twitter: @JStanleyFX


