Canadian Dollar, USD/CAD, Loonie Price Outlook
- USD/CAD spent a month in a range, but saw sellers pounce this week.
- As USD has pushed down to a fresh low, USD/CAD has followed.
- A big level of support lurks just below current prices – the same that turned around the June sell-off; will buyers show up for a second round of support or will sellers’ persistence drive to an even lower-low?
USD/CAD Breaks Down, Leaves 1.3500 Behind
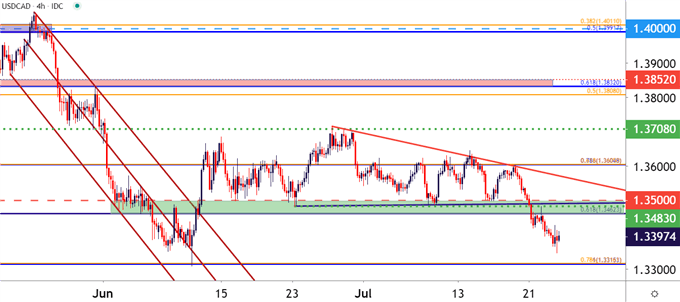
Consistency can be a sought after trait for traders looking for amenable markets, and for more than a month, USD/CAD remained in a fairly consistent range-bound pattern. That range built in support around the 1.3500 handle, and saw no fewer than four separate tests of this zone from mid-June into mid-July. Context can be helpful, as well, so before this range had built, a consistent sell-off had driven USD/CAD down to a key spot on the chart, taken from around the 1.3315 area that functions as both the March swing low and the 78.6% Fibonacci retracement of the 2020 move in the pair.
That confluent price helped to stop the sell-off dead in its tracks; and prices soon pushed back into the range that held through June and into July. But this week saw some change show up as sellers finally grabbed the reins to push price action down to a fresh monthly low, finally taking out that 1.3500 support zone along the way.
USD/CAD Four-Hour Price Chart

Chart prepared by James Stanley; USDCAD on Tradingview
USD/CAD Finds Resistance at Prior Support – Then Goes
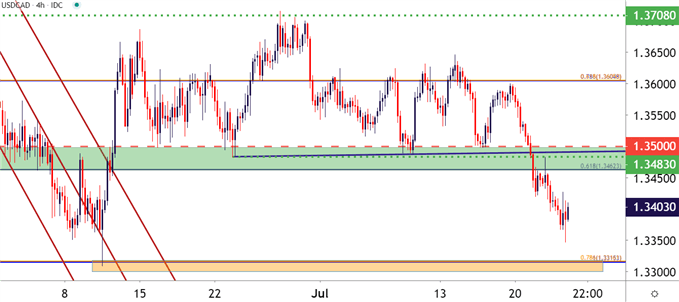
As looked at in the Tuesday webinar, the breakdown in USD/CAD appeared to be a bit more mild than the similar breakouts showing in other USD-pairs. And given the fact that the support zone taken-out had elicited no fewer than four tests since early-June, and it makes sense as to why sellers may have been trepidatious to continue driving whilst at that fresh near-term low.
But yesterday saw a quick flicker of strength, just long enough for price action to push up to that prior zone of support. The price of 1.3483 was key as this marks yesterday’s high and is also the low from 23 June: After that level came into play during yesterday’s trade sellers came back, took control, and continued to drive down to another fresh low.
The big question now is for how long might bears be able to drive? Another key point of support is fast approaching and this could complicate bearish continuation plays as price action has moved further and further away from any recent points of resistance. This can keep the door open for a possible second test of resistance at that prior zone of support. Of particular note is the price of 1.3462, marking the bottom of this zone and functioning as the 61.8% retracement of the long-term major move, spanning the 2001 high down to the 2008 low. That price, extended up to the 1.3500 psychological level, comprises the zone and a hold of resistance here can keep the door open for bearish continuation scenarios.
USD/CAD Four-Hour Price Chart

Chart prepared by James Stanley; USDCAD on Tradingview
--- Written by James Stanley, Strategist for DailyFX.com
Contact and follow James on Twitter: @JStanleyFX

