Canadian Dollar, CAD, USD/CAD, AUD/CAD Talking Points:
- USD/CAD is re-testing a key area of support.
- AUD/CAD has broken down to a fresh three-month-low following last week’s descending triangle formation.
- The analysis contained in article relies on price action and chart formations. To learn more about price action or chart patterns, check out our DailyFX Education section.
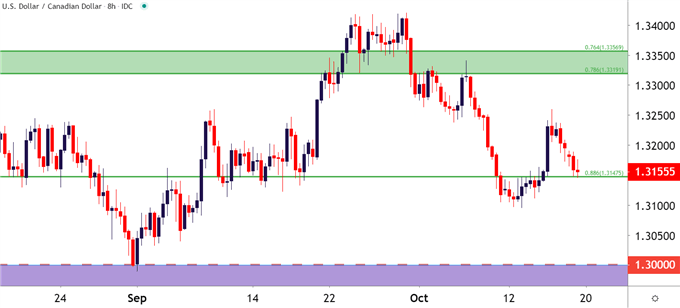
It’s been another bearish start to the week for the US Dollar, and in USD/CAD, this has helped the pair to push back down to a key area of support. This is around the same area that prices were trading at when I last wrote on the matter; and back then, I noted the general penchant towards CAD-strength as USD-weakness remained a primary theme. That scenario has dissipated a bit as the latter portion of last week brought in a quick bump into USD/CAD; but that move has largely been priced-out through this morning’s open with price action returning directly to this key spot of support on the chart.
USD/CAD Eight-Hour Price Chart

Chart prepared by James Stanley; USDCAD on Tradingview
USD/CAD Bigger Picture: 1.3000 Looms Large
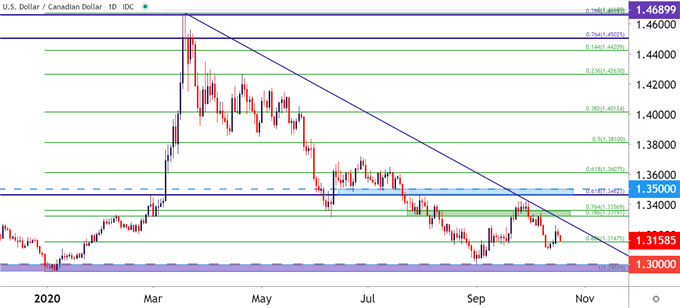
Taking a step back on the chart, and this current zone of support highlights a number of recent inflections. This level is taken from the 88.6% retracement of the Fibonacci retracement drawn from the December low up to the March high. This price started to come back into play as support in August, with another round of support through mid-September. Most recently, this showed up as some short-term resistance last week but as noted in that prior article, the backdrop could be difficult for bearish continuation given the lurking support just below price action.
The 1.3000 level has somewhat of a historical quality in the pair. This psychological level was teased throughout the second half of last year, but finally came into play on the final trading day of 2019. And for the first week of this year, price action hung out sub-1.3000 for a while; but bulls quickly got to work and pushed prices higher for the next two-and-a-half months.
To learn more about psychological levels, check out our DailyFX Education section.
That 1.3000 level came back into play in early-September but, similarly, sellers couldn’t muster much continuation and prices quickly bounced from that psychological level. With that price now lurking so close to current prices, are bears going to be able to elicit another test?
USD/CAD Daily Price Chart

Chart prepared by James Stanley; USDCAD on Tradingview
AUD/CAD Breaks Down
Given proximity to longer-term support in USD/CAD, CAD-bulls may want to look elsewhere and one potential option looked at last week was in AUD/CAD.
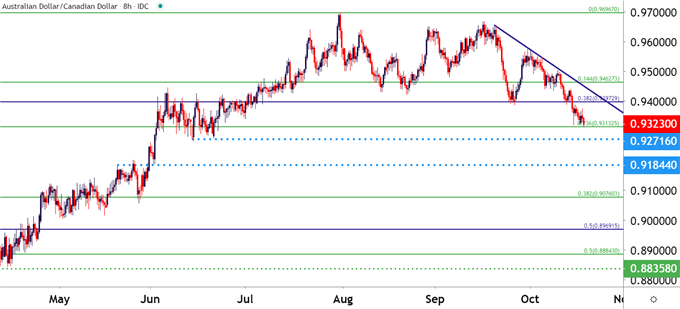
AUD/CAD had taken on tones of a descending triangle, with horizontal support holding amidst a series of lower-highs. That setup has filled in and prices have broken down to a fresh low. Follow-through supports could be sought out around .9272, .9184 and then around .9076.
To learn more about descending triangles, check out our DailyFX Education section.
AUD/CAD Eight-Hour Price Chart

Chart prepared by James Stanley; AUDCAD on Tradingview
--- Written by James Stanley, Strategist for DailyFX.com
Contact and follow James on Twitter: @JStanleyFX


