Canadian Dollar, CAD, USD/CAD Price Analysis
- USD/CAD has rallied by as much as 130 pips from the recent lows, even with the US Dollar continuing to push to its own two-year-lows.
- USD/CAD has re-engaged with a key zone on the chart, an area that previously elicited support now coming in to help show near-term resistance.
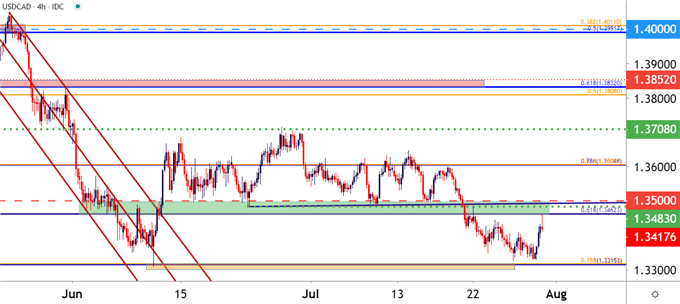
- Can sellers take out the confluent 1.3315 spot on the USD/CAD chart? This week has already seen bears take a step back on two different occasions before a test could show in the confluent area.
USD/CAD Pops Even as the US Dollar Drops
It’s been a pretty brutal backdrop for the US Dollar so far in Q3; and while this is along the lines of what was being looked for in the Q3 technical forecast, the force and speed with which the US Dollar has sold off is likely taking many by surprise. This morning sees the US Dollar push down to an even fresher two-year-low but, curiously, USD/CAD has spent much of today going in the opposite direction with the pair popping by as much as 130 pips until a key zone of resistance could come into play.
This somewhat syncs with earlier week price action as breakouts were running wild in USD-pairs such as EUR/USD and GBP/USD. USD/CAD, however, remained quite a bit more subdued, pushing down to a fresh low and then stalling before a test of the 1.3315 level could come into play. That 1.3315 spot is what marks the current four-month-low after it came into play in early-June.
USD/CAD Four-Hour Price Chart

Chart prepared by James Stanley; USDCAD on Tradingview
USD/CAD Caught Between Two Key Levels
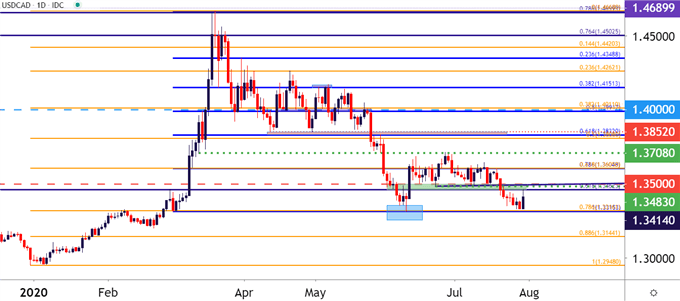
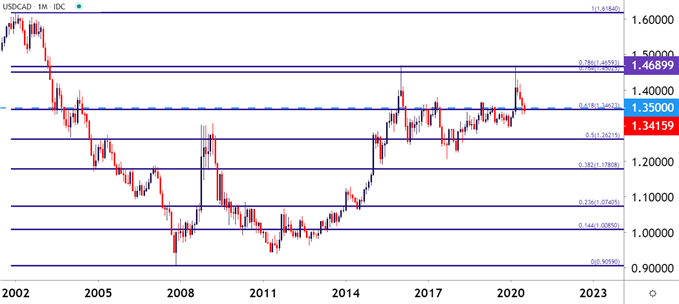
Taking a step back on the chart and we can see some longer-term, bigger-picture implications around current support and resistance levels; especially considering the rollercoaster of 2020 price action in the pair.
After coming into 2020 below the 1.3000 level, bulls took control and pushed the matter for the first two-and-a-half months of the year. Price action pushed all the way up to the 1.4670 area – less than 20 pips away from the 17-year-high in the pair. But buyers couldn’t push a test up to that level and what started as a pullback soon turned into an aggressive reversal with sellers taking out 78.6% of that bullish 2020 move until buyers stepped-in to offer some support in early-June. This is where the 1.3315 level comes from, marking both that four-month-low and the 78.6% retracement of the 2020 major move: The same price that bears apparently didn’t want to test this week.
USD/CAD Daily Price Chart

Chart prepared by James Stanley; USDCAD on Tradingview
On the near-term resistance side of the coin, the 1.3462 level is of note as this is the 61.8% marker of that 17-year major move. And this level, along with the psychological 1.3500 level, helped to set a support zone that held the lows in USD/CAD for more than a month, spanning from early-June through mid-July. The aggressive bearish trend in the US Dollar finally allowed for that zone to be taken-out as sellers were on the prowl last week but, until this morning, there hadn’t been much for resistance at this spot. Now that this price has come back into play, the big question is whether its time for sellers’ return; or whether this is a mere pause point in a bigger picture retracement or pullback.
USD/CAD Monthly Price Chart

Chart prepared by James Stanley; USDCAD on Tradingview
--- Written by James Stanley, Strategist for DailyFX.com
Contact and follow James on Twitter: @JStanleyFX

