Canadian Dollar, USD/CAD, Coronavirus Restrictions, Bank of Canada, IGCS – Talking Points:
- Risk appetite notably faded to kick-off a fresh week of trade as attention shifts to President-elect Biden’s upcoming inauguration.
- Deteriorating health outcomes and economic data may weigh on the Canadian Dollar ahead of the Bank of Canada’s upcoming rate decision.
- A Double Bottom reversal pattern hints at further upside for USD/CAD in the short-term.
Asia-Pacific Recap
Risk appetite notably faded during Asia-Pacific trade as investors look towards President-elect Joe Biden’s inauguration on January 20. Australia’s ASX 200 fell 0.78% and Japan’s Nikkei 225 slid 0.97%, as local health authorities reported a record number of coronavirus patients.
China’s CSI 300 index rose 1.13% alongside Hong Kong’s Hang Seng index on the back of better-than-expected Chinese Q4 GDP and industrial production figures. In FX markets, the risk-sensitive AUD, NZD and CAD lost ground, while the haven-associated USD and JPY largely outperformed.
Gold and silver prices clawed back lost ground after selling-off drastically at the start of the session, finishing 0.5% and 1.26% higher respectively. Looking ahead, a speech from European Central Bank President Christine Lagarde headlines the economic docket alongside Italian inflation data for December.

DailyFX Economic Calendar
Deteriorating Health Outcomes to Weigh on CAD
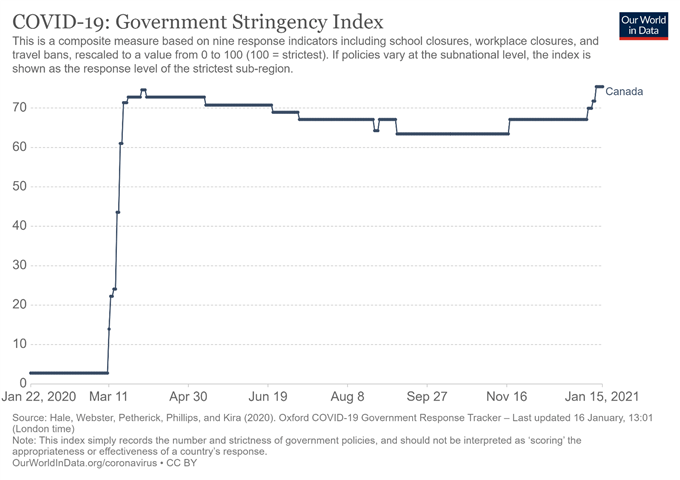
The relentless surge of coronavirus cases in Canada may continue to weigh on the local currency in the near term. The University of Oxford’s Government Response Stringency Index shows that the nation is currently enduring the most stringent restrictions since March, as Ontario – Canada’s most populous province – issued a stay-at-home order on January 12.
However, the marked tightening of curbs has yet to have a meaningful impact on the infection rate. The 7-day moving average tracking daily Covid-19 cases is currently hovering more than 3 times higher than the peaks seen in March while the number of deaths per day has jumped back above 150.

This deterioration in health outcomes has had a notable impact on the country’s nascent economic recovery and could encourage the Bank of Canada to ease its monetary policy settings further at its upcoming meeting on January 20. After all, the unemployment rate climbed to 8.6% (prev. 8.5%) in December, while the participation rate dropped to 64.9% (prev. 65.1%).
That being said, with the BoC reducing its Quantitative Easing (QE) program’s total purchases to “at least $4 billion a week”, and Governor Tiff Macklem stating that “as much as bold policy response is needed, it will inevitably make the economy and financial system more vulnerable to economic shocks down the road”, further easing seems relatively unlikely.
Nevertheless, the marked tightening of restrictions and the notable deterioration in economic data may fuel easing bets ahead of the BoC’s monetary policy meeting and weigh on the Canadian Dollar in the near term.

Source – Worldometer
USD/CAD Daily Chart – Bullish Engulfing Hints at Further Gains
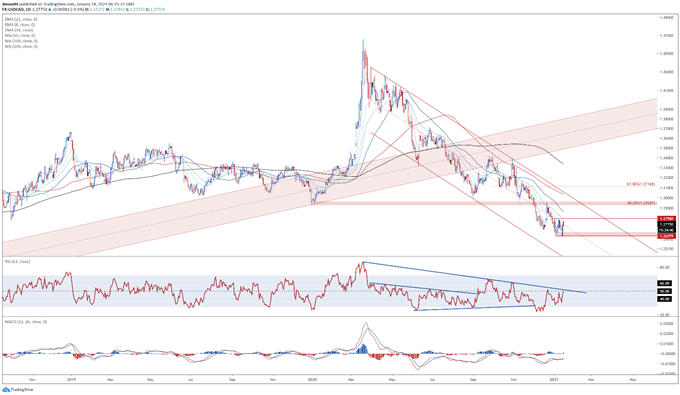
The formation of a Bullish Engulfing candle just above psychological support at 1.2600 suggests that USD/CAD rates may continue climbing higher in the near term.
A bullish crossover on the MACD indicator, in tandem with the RSI clambering back above 40, hints at building buying pressure and could indicate that the path of least resistance is higher.
A daily close above the 34-day exponential moving average (1.2804) would likely neutralize short-term selling pressure and carve a path for price to challenge confluent resistance at the Descending Channel downtrend and 38.2% Fibonacci (1.2929).
Alternatively, failing to clear the 1.2800 mark could trigger a push back towards range support at 1.2630 – 1.2660. Clearing that probably signals the resumption of the primary downtrend and brings 1.2500 into focus.

USD/CAD daily chart created using Tradingview
USD/CAD 4-Hour Chart – Double Bottom Reversal in Play
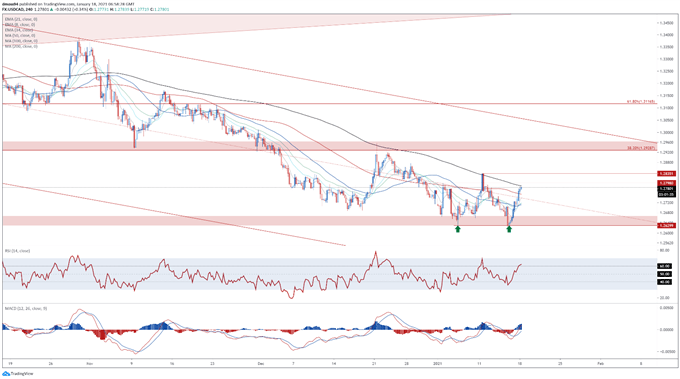
Zooming into a four-hour chart bolsters the bullish outlook depicted on the daily timeframe, as the exchange rate carves out a Double Bottom reversal pattern.
Clearing the sentiment-defining 200-MA (1.2787) opens the door for buyers to challenge the Double Bottom’s neckline (1.2835), with a convincing push above needed to validate the bullish reversal pattern.
The pattern’s implied measured move suggesting that USD/CAD could push through range resistance at 1.2930 – 1.2960 to challenge the psychologically imposing 1.3000 mark.
Conversely, if buyers fail to breach resistance at 1.2800 could allow sellers to regain control of the exchange rate and drive price back towards the monthly low (1.2625)

USD/CAD 4-hour chart created using Tradingview
IG Client Sentiment Report
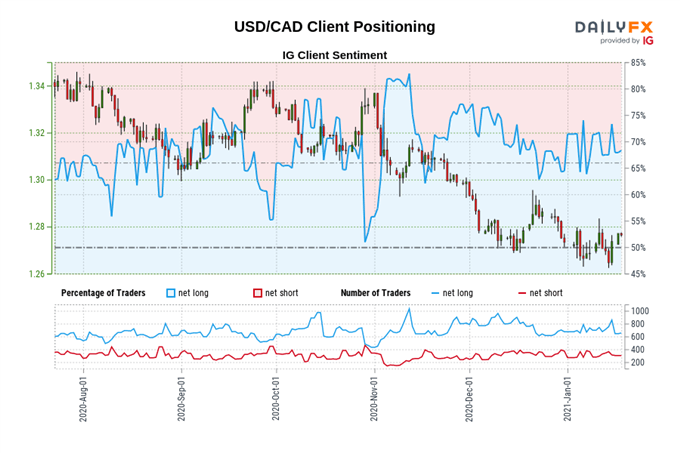
The IG Client Sentiment Report shows 66.05% of traders are net-long with the ratio of traders long to short at 1.95 to 1. The number of traders net-long is 5.29% higher than yesterday and 6.10% lower from last week, while the number of traders net-short is 14.47% higher than yesterday and 20.00% higher from last week.
We typically take a contrarian view to crowd sentiment, and the fact traders are net-long suggests USD/CAD prices may continue to fall.
Yet traders are less net-long than yesterday and compared with last week. Recent changes in sentiment warn that the current USD/CAD price trend may soon reverse higher despite the fact traders remain net-long.

-- Written by Daniel Moss, Analyst for DailyFX
Follow me on Twitter @DanielGMoss

