Canadian Dollar Technical Price Outlook: USD/CAD Weekly Trade Levels
- USD/CAD put in a massive reversal last week on the back of the FOMC.
- Does the reversal have staying power? Short-term bullish momentum keeps the door open for higher-highs.
- The analysis contained in article relies on price action and chart formations. To learn more about price action or chart patterns, check out our DailyFX Education section.
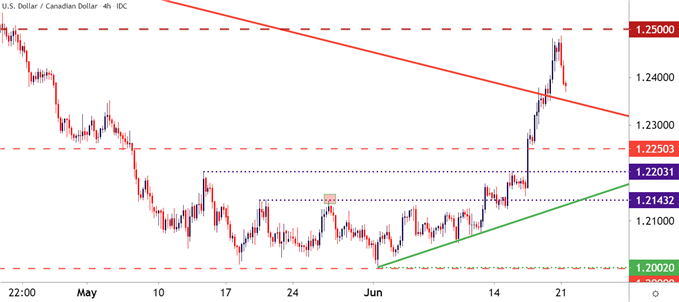
Last week was big for USD/CAD, as a major push higher by bulls broke through a number of resistance levels.
It was earlier in June when sellers remained in-control of USD/CAD, angling for another test of the 1.2000 psychological level. But, as I had warned a few days prior, bears were already looking beleaguered, and a pullback started to seem more probable. On June 2nd, bears took their swing but ended up falling short, creating a swing low at the 1.2002 spot. And as I said in the webinar last week, this was a prime example of a psychological level exerting influence on the market without having actually come into play.
To learn more about psychological levels, check out DailyFX Education
Through the next couple weeks in June, ahead of the FOMC rate decision, prices continued to work-higher. Along the way a less-hawkish Bank of Canada helped to bring a bit of CAD weakness into the equation.
But it was the FOMC rate decision that made a serious dent. The Fed highlighted the potential for two rate hikes in 2023 and the US Dollar started to fly against many currencies, CAD included. Friday saw some thickening of the drama as St. Louis Fed President, James Bullard, warned that he might be willing to raise rates in 2022, even faster than the Fed had warned of just a couple of days prior. In response, the US Dollar drove even-higher and USD/CAD made a fast run towards the 1.2500 psychological level.
USD/CAD Four-Hour Price Chart

Chart prepared by James Stanley; USDCAD on Tradingview
USD/CAD: Fade or Follow?
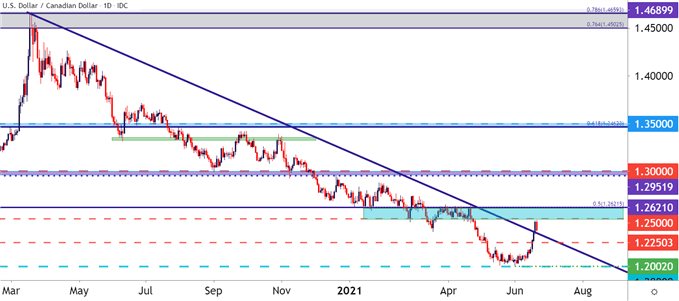
Taking a step back to look at longer-term dynamics and USD/CAD has been probably one of the cleaner short-side USD trends. There’s a trendline connecting from last March’s high to this April’s high and this was finally taken-out on that Friday move. This also highlights how built-in that bearish trend had become over the past year, hastening in April with the BoC took a relatively hawkish stance at their meeting which is what drove USD/CAD towards the 1.2000 handle.
USD/CAD Daily Price Chart

Chart prepared by James Stanley; USDCAD on Tradingview
But, now that the trendline is broken, can bulls have more room to run? Well this is likely going to depend on just how hawkish the Fed sounds in the aftermath of last week’s rate decision, and there’s a plethora of Fed speak coming to the headlines this week to speak to that topic.
Also of interest, there’s a PCE release on Friday, and this is the Fed’s preferred inflation gauge. Judging by Treasury rates, markets are a bit more comfortable with the ‘inflation as a transitory theme’ thesis; the bigger question is just how comfortable the rest of the FOMC is it and we’ll hear plenty about that this week.
USD/CAD Short-Term
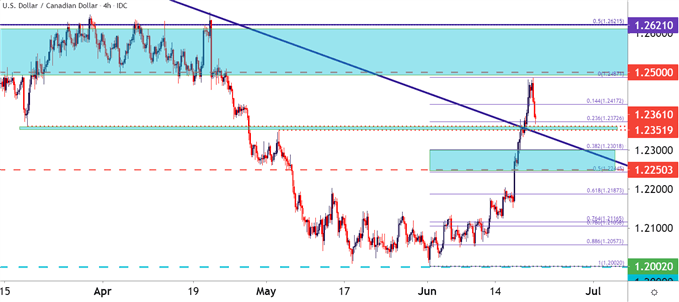
At this point, short-term strategies will likely be focusing on the surge in last week’s bullish momentum. At this point, price action is testing the 23.6% Fibonacci retracement of the June bounce, and this lines up with an area of prior swing support/resistance around the 1.2350-60 area. This could be looked at as an area of key support for short-term bullish trend strategies. A secondary support zone could be sought out around the 1.2250-1.2300 zone.
To learn more about Fibonacci, check out DailyFX Education
USD/CAD Four-Hour Price Chart

Chart prepared by James Stanley; USDCAD on Tradingview
USD/CAD Longer-Term
On a bigger picture basis, last week’s bounce is interesting in the context of longer-term bearish continuation potential. Price action made a fast approach towards a big zone but didn’t quite test the area starting around the 1.2500 handle. This could require some patience as is often the case with a longer-term approach, looking for the short-term bullish momentum to continue higher until this big zone of resistance can come into play.
Outside of that, if this zone does not get tested, sellers can look for a move back-below the 1.2250 level to indicate a return of bearish momentum. That would come along with a nullification of the short-term bullish structure that can put bears back in the driver’s seat for near-term trends.
--- Written by James Stanley, Senior Strategist for DailyFX.com
Contact and follow James on Twitter: @JStanleyFX


