Canadian Dollar, USD/CAD, Canadian Employment Data, Coronavirus Vaccinations - Talking Points:
- Equity markets traded broadly mixed during APAC trade despite a strong Wall Street session overnight.
- Upcoming Canadian jobs data will likely dictate the near-term trajectory of the USD/CAD exchange rate.
- The formation of a bullish Falling Wedge formation could inspire buyers to drive USD/CAD higher.
The Quiz
Discover what kind of forex trader you are
Asia-Pacific Recap
Equity markets traded mixed during Asia-Pacific trade after a relatively robust Wall Street session overnight that saw the benchmark S&P 500 climb to fresh record highs, on the back of commentary from Federal Reserve Chair Jerome Powell reiterating the central bank’s accommodative monetary policy stance. Australia’s ASX 200 dipped lower alongside Hong Kong’s Hang Seng Index, while China’s CSI 300 plunged 1.3%.
In FX markets, the Australian Dollar fell after the release of the RBA’s semi-annual report on financial stability, while the haven-associated US Dollar, Japanese Yen and Swiss Franc gained ground against their major counterparts. Gold price traded slightly lower as yields on US 10-year Treasuries jumped 2 basis points higher. Looking ahead, Canadian jobs data and PPI figures out of the US headline the economic docket.
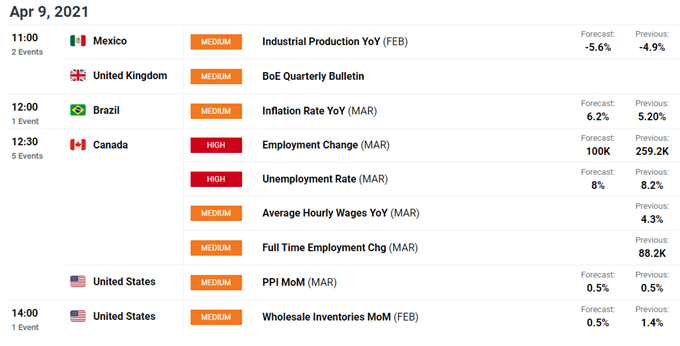
Employment Data to Dictate USD/CAD Trajectory
As mentioned in previous reports, resilient oil prices and the Bank of Canada’s hawkish stance in comparison to the majority of its peers has driven the risk-sensitive Canadian Dollar higher against the haven-associated Japanese Yen and Swiss France for the majority of 2021. However, against its US counterpart, the commodity-linked currency has lost a considerable amount of ground since climbing to its highest levels since early-2018.
These struggles appear to be on the back of the notable divergence in the rate of coronavirus vaccine distribution, and the marked easing of restrictions in the United States. In contrast, with the 7-day moving average tracking infections climbing back above 6,000 for the first time since January, the Canadian province of Ontario has been forced to impose a four-week stay-at-home order, resulting in the closure of all non-essential businesses.
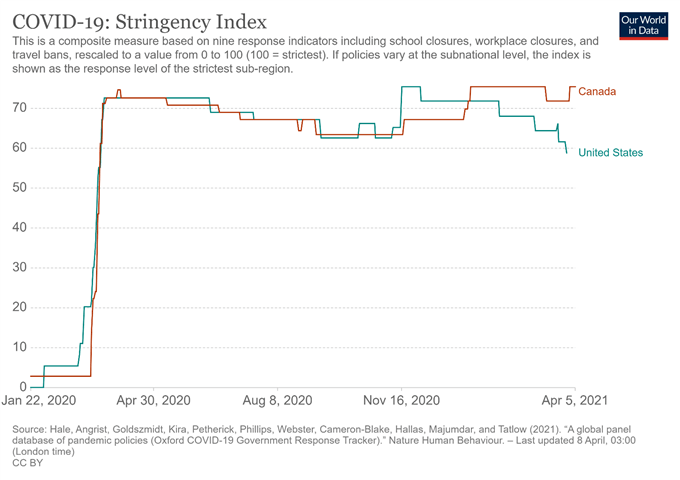
Indeed, with only 16.5% of Canadians having received at least one dose of a Covid-19 vaccine, there is the possibility that the local economy may not return to a level of normality as quickly as previously expected. In comparison, 33% of Americans have received at least one shot, with the nation on course to vaccinate 75% of the population – the amount needed to achieve herd immunity – within the next three months.
With that in mind, attention will be intently focused on upcoming jobs figures out of Canada, given the robust non-farm payrolls figures out of the US earlier this month. Disappointing figures would reinforce the divergence in economic fundamentals between the two countries and probably drive the USD/CAD exchange rate higher.
USD/CAD Daily Chart – Falling Wedge Resistance Under Pressure
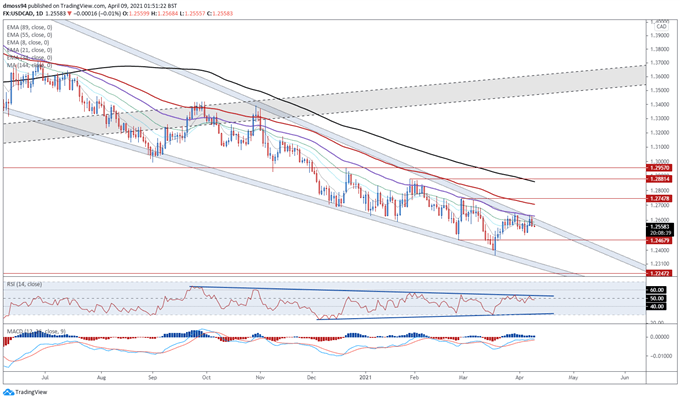
Chart prepared by Daniel Moss, created with Tradingview
From a technical perspective, the outlook for USD/CAD remains relatively bearish, as prices continue to track below all six moving averages.
However, the formation of a bullish Falling Wedge formation suggests that a topside reversal could be on the cards, if buyers can successfully drive the exchange rate back above the trend-defining 55-EMA (1.2628).
This could trigger an impulsive upside move to challenge the March high (1.2737), with a convincing break above bringing the 144-EMA (1.2965) into the crosshairs.
Alternatively, if the 1.2600 handle remains intact, sellers may regain control of the exchange rate and drive prices back towards the yearly low (1.2365).
USD/CAD 4-Hour Chart – Ascending Triangle In Play?
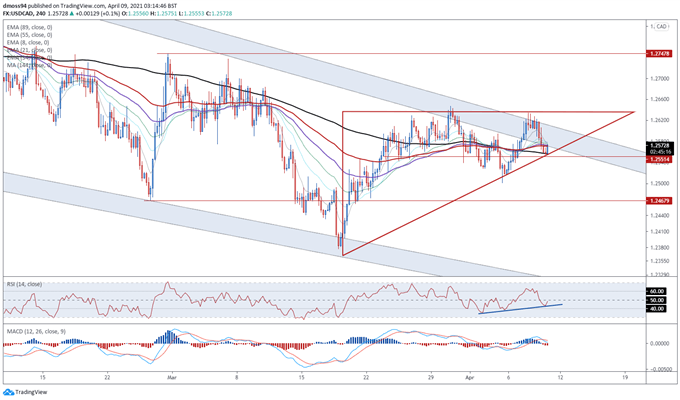
Chart prepared by Daniel Moss, created with Tradingview
Zooming into the 4-hour chart also hints at a possible topside break for USD/CAD rates, as prices carve out an Ascending Triangle pattern just below key resistance at 1.2650.
With the RSI eyeing a push back above its neutral midpoint, and price surging away from the sentiment-defining 144-EMA (1.2556), the path of least resistance seems higher.
Remaining constructively positioned above 1.2550 suggests that a test of triangle resistance is likely in the near term, with a break above needed to bring the February 25 high (1.2748) into focus. However, if 1.2550 gives way, a retest of the monthly low (1.2502) could be on the cards.
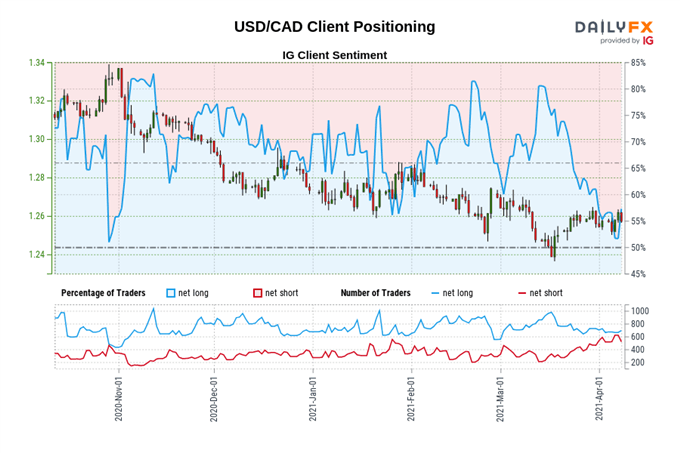
The IG Client Sentiment Report shows 52.07% of traders are net-long with the ratio of traders long to short at 1.09 to 1. The number of traders net-long is 0.43% higher than yesterday and 1.14% lower from last week, while the number of traders net-short is 22.69% higher than yesterday and 5.80% higher from last week.
We typically take a contrarian view to crowd sentiment, and the fact traders are net-long suggests USD/CAD prices may continue to fall.
Yet traders are less net-long than yesterday and compared with last week. Recent changes in sentiment warn that the current USD/CAD price trend may soon reverse higher despite the fact traders remain net-long.
-- Written by Daniel Moss, Analyst for DailyFX
Follow me on Twitter @DanielGMoss

