Canadian Dollar, USD/CAD, Bank of Canada, Crude Oil, Core PCE Index – Talking Points:
- Equity markets followed Wall Street’s lead overnight, broadly gaining during the APAC session.
- A marked sell-off in oil prices and a bout of risk aversion has buoyed the US Dollar against the higher-beta Canadian Dollar as of late.
- However, this may prove to be short-lived given the recent hawkish shift of the Bank of Canada.
The Quiz
Discover what kind of forex trader you are
Asia-Pacific Recap
Equity markets followed on from Wall Street’s lead overnight and broadly gained ground during Asia-Pacific trade. Australia’s ASX 200, Japan’s Nikkei 225, and Hong Kong’s Hang Seng Index all climbed 0.5%, 1.56%, and 1.6% respectively. China’s CSI 300 outperformed however, surging 2.23% as the World Bank stated that the world’s second largest economy is set to grow 8.1% in 2021.
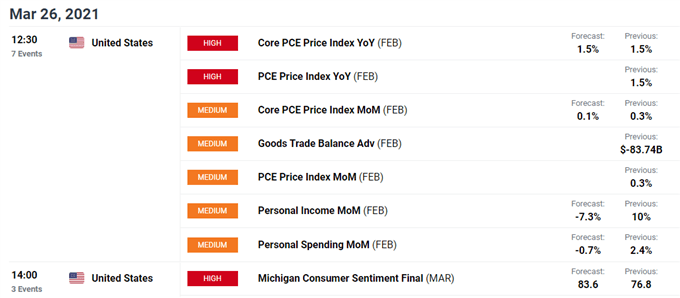
In FX markets, the commodity-linked AUD, NZD, CAD and NOK outperformed their major counterparts, while the haven-associated USD, JPY and CHF fell out of favour. Gold and silver prices nudged marginally higher as yields on US 10-year Treasuries held relatively steady, while oil prices gained just over 2% after authorities stated that efforts to unblock the Suez Canal could take up to a week. Looking ahead, US consumer sentiment and core PCE figures headline the economic docket.

DailyFX Economic Calendar
US PCE Data to Define USD/CAD Trajectory
The US Dollar has rebounded robustly against its Canadian counterpart recently, gaining just under 2% after falling to its lowest levels since early 2018 on March 19. Safe haven flows have been the primary driver of the Greenback’s recovery, as rising coronavirus cases in the US threaten to prolong the world’s largest economy’s return to normality. The seven-day moving average tracking Covid-19 infections registered its largest increasing since January 12 on Wednesday, rising almost 10% on a weekly basis according to data from John Hopkins University.
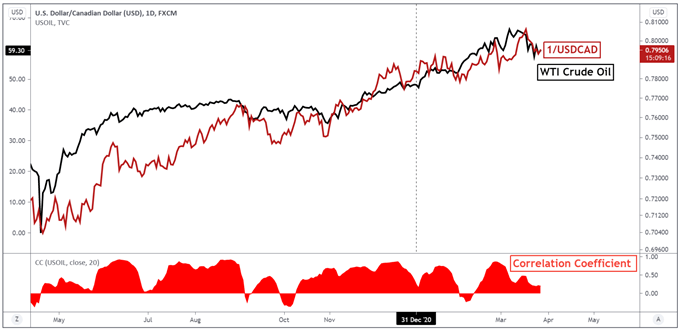
Tightening lockdown measures across Europe have also gnawed at market sentiment and buoyed the anti-risk Greenback, as the vaccine rollout in the trading bloc continues to travel at a snail’s pace. This has increased concerns about the demand for energy-related commodities, with crude oil prices continuing to grind lower despite a blockage at the Suez Canal sparking global supply distribution fears.
USD/CAD Price Inversed vs WTI Crude Oil Prices

Chart prepared by Daniel Moss, created with Tradingview
However, these dynamics may only prove to temporarily support the USD/CAD exchange rate, given the pace of inoculations in the US and the recent commentary from the Bank of Canada’s Deputy Governor Toni Gravelle. Gravelle signalled that the BoC may look to wind down its quantitative easing program gradually and in measured steps, as the local economy continues to bounce bank strongly.
This has fuelled speculation that the central bank will taper its bond-purchasing scheme even further at its upcoming meeting in April. The BoC reduced its total purchases of government debt from $5 billion to $4 billion a week in November.
Attention now turns to US personal income and PCE figures for February, with market participants focusing intently on whether the Federal Reserve’s primary measure of inflation overshoots expectations. A higher-than-expected reading could reignite consumer price growth fears and stoke Fed hiking bets, driving Treasury yields higher alongside the US Dollar. On the other hand, a relatively soft print could soothe investors’ worries and pave the way for the USD/CAD to continue its primary downside move.
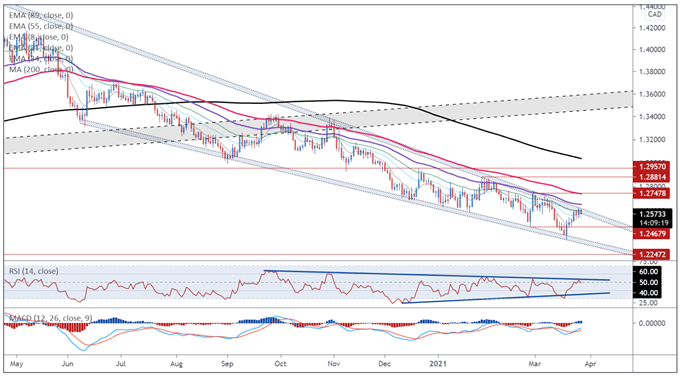
USD/CAD Daily Chart – 12-Month Downtrend Remains Intact

Chart prepared by Daniel Moss, created with Tradingview
From a technical perspective, the outlook for USD/CAD rates remains skewed to the downside, as price tracks firmly below the trend-defining 55-EMA (1.2653) and continues to respect the downtrend extending from the March 2020 highs.
With the MACD travelling below its neutral midpoint, and the RSI failing to break convincingly above 50, the path of least resistance seems lower. A daily close back below the 8-EMA (1.2555) would probably intensify near-term selling pressure and propel price back towards the yearly low (1.2365). Clearing that brings the 2018 low (1.2247) into the crosshairs.
Alternatively, gaining a firm foothold above the 55-EMA likely validates the break of 12-month trend resistance, signalling a bullish shift in trend. If this were to occur, look for price to potentially charge back to challenge the yearly high set in January (1.2881) However, it must be noted that the latter scenario seems relatively unlikely given the multitude of bearish technical signals on display.

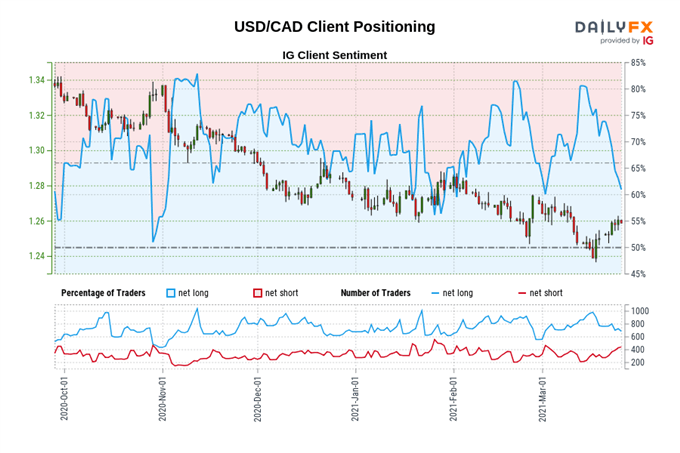
The IG Client Sentiment Report shows 61.48% of traders are net-long with the ratio of traders long to short at 1.60 to 1. The number of traders net-long is 4.76% lower than yesterday and 12.82% lower from last week, while the number of traders net-short is 5.96% lower than yesterday and 35.67% higher from last week.
We typically take a contrarian view to crowd sentiment, and the fact traders are net-long suggests USD/CAD prices may continue to fall.
Positioning is more net-long than yesterday but less net-long from last week. The combination of current sentiment and recent changes gives us a further mixed USD/CAD trading bias.
-- Written by Daniel Moss, Analyst for DailyFX
Follow me on Twitter @DanielGMoss

