Canadian Dollar, USD/CAD, CAD/JPY, Fiscal Stimulus, Canadian GDP – Talking Points:
- Equity markets moved higher during APAC trade as investors cheered promising coronavirus vaccine news and strong economic data.
- The provision of additional fiscal stimulus, and a record expansion in economic activity, may propel the Canadian Dollar higher.
- USD/CAD eyeing yearly lows after breaching key support.
- CAD/JPY rates continue carving out an Ascending Triangle pattern.
Asia-Pacific Recap
Equity markets kicked-off a fresh trading month on the front foot, as investors cheered news that Moderna is seeking regulatory approval for its Covid-19 vaccine in Europe and the US. Australia’s ASX 200 index rose 1.08% and Hong Kong’s Hang Seng index pushed 1.12% higher.
China’s CSI 300 surged 1.72% on the back of a historic surge in local manufacturing activity, as Caixin Manufacturing PMI climbed to its highest levels in a decade.
In FX markets, the haven-associated US Dollar and Japanese Yen lost ground against their major counterparts, while the risk-sensitive AUD, NZD, and CAD largely outperformed.
Crude oil prices slipped below $45 as OPEC+ delays its output policy talks until November 3. Gold pushed back above $1780 after falling to its lowest levels since early July.
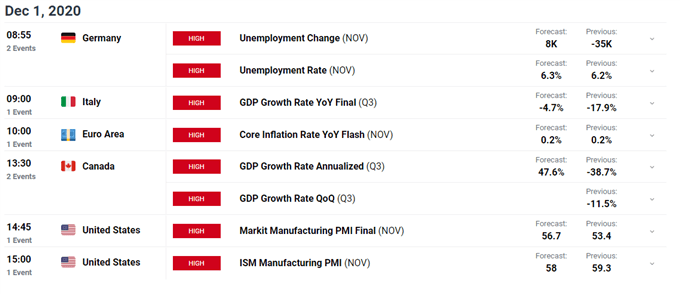
Looking ahead, US manufacturing PMI for November and Canada’s third-quarter GDP release headline the economic docket alongside inflation figures out of the Euro-zone.
Record GDP Expansion to Fuel CAD
The Canadian Dollar has largely outperformed its haven-associated counterparts in November, climbing over 2.5% against the Japanese Yen and US Dollar.
These gains look set to continue in the near term, with the currency aiming higher on the back of a historic expansion in economic activity and the provision of additional fiscal stimulus. Canadian GDP is estimated to have grown 47.6% – on an annualized basis – in the third quarter, as businesses reopened and consumers spent their government subsidies.
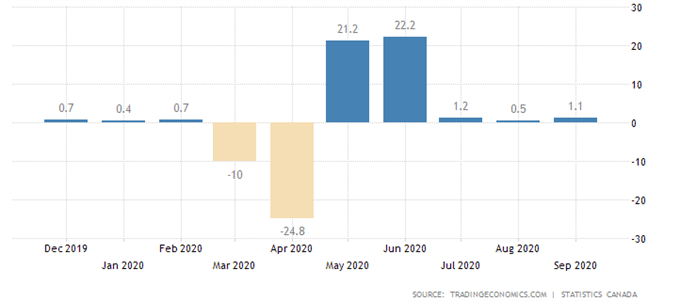
Retail sales have rebounded robustly from the April nadir, climbing back to pre-crisis levels just two months after the nation recorded its largest fall in consumer spending. The local housing market has also recovered strongly as buyers take advantage of record low interest rates, driving prices over 16% higher when compared to the same time last year.
Canadian Retail Sales
However, with several Canadian provinces tightening coronavirus restrictions and Prime Minister Justin Trudeau warning that most citizens won’t be vaccinated until “next September”, a more marked slowdown in economic growth looks relatively likely.
That being said, the unveiling of over C$51.7 billion of additional fiscal aid by Finance Minister Chrystia Freeland may temper the economic drop-off. The measures include an enhanced wage subsidy program – expected to cover up to 75% of payroll costs – and the extension of commercial rent and lockdown support.
Freeland stated that “our government will make carefully judged, targeted and meaningful investments to create jobs and boost growth [and] will provide the fiscal support the Canadian economy needs to operate at its full capacity and to stop Covid-19 from doing long-term damage to our economic potential”.
Therefore, investors may dismiss the worrying rise in local Covid-19 cases and put a premium on the risk-sensitive Canadian Dollar, as the government retains its whatever-it-takes approach to fiscal policy.
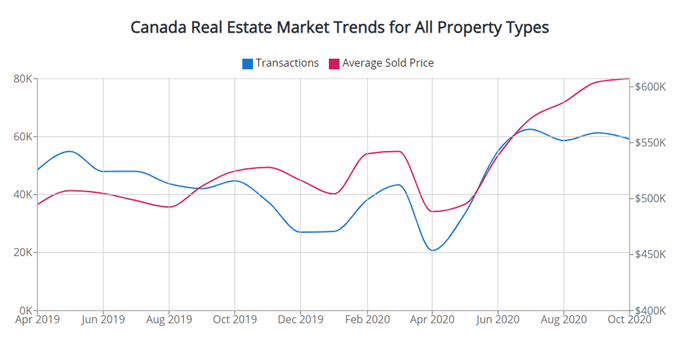
Source – WOWA
USD/CAD Daily Chart – Descending Channel Guiding Price Lower
USD/CAD’s technical outlook remains skewed to the downside, as prices eye a push to fresh yearly lows after breaching key psychological support at 1.3000.
With the RSI slipping back below 40 and the MACD tracking firmly below its neutral midpoint, the path of least resistance looks lower.
A daily close below the December 2019 low (1.2952) is probably required to clear a path towards the November low (1.2923).
Breaching that would likely signal the resumption of the primary downtrend and bring the October 2018 low (1.2783) into focus.
Alternatively, USD/CAD could rebound back towards the 50% Fibonacci (1.3040) if range support at 1.2930 – 1.2950 holds firm.
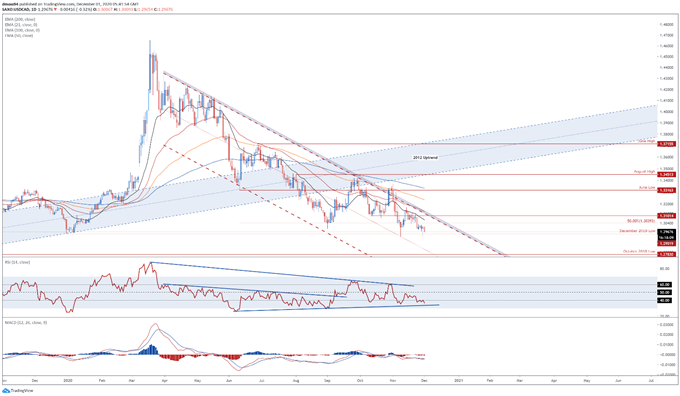
USD/CAD daily chart created using Tradingview
USD/CAD IG Client Sentiment Report
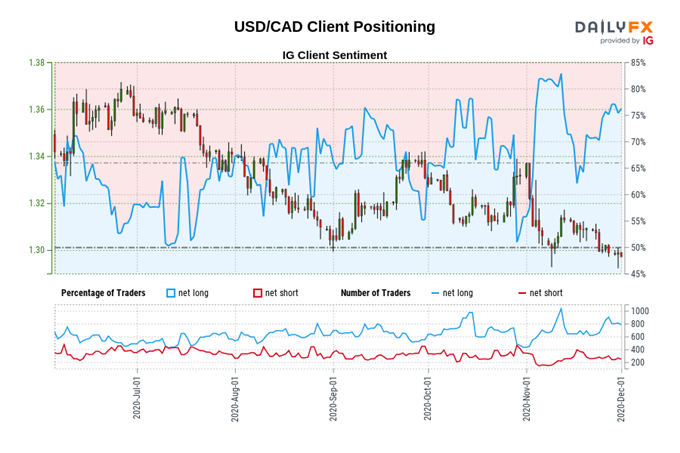
IG Client Sentiment data shows 76.17% of traders are net-long with the ratio of traders long to short at 3.20 to 1. The number of traders net-long is 0.25% higher than yesterday and 22.74% higher from last week, while the number of traders net-short is 6.93% lower than yesterday and 3.77% lower from last week.
We typically take a contrarian view to crowd sentiment, and the fact traders are net-long suggests USD/CAD prices may continue to fall.
Traders are further net-long than yesterday and last week, and the combination of current sentiment and recent changes gives us a stronger USD/CAD-bearish contrarian trading bias.
CAD/JPY Daily Chart – Ascending Triangle in Play
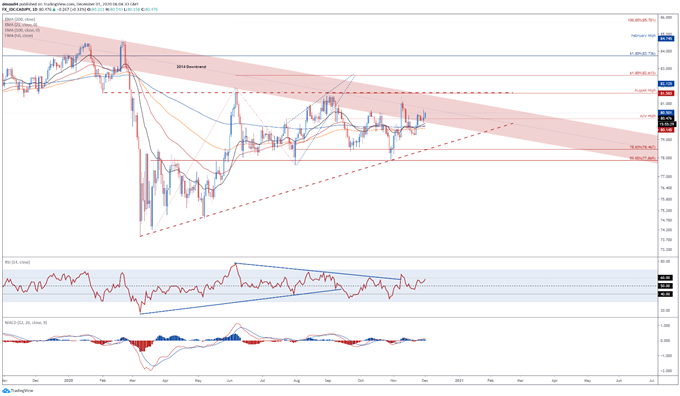
CAD/JPY rates look poised to move higher, as prices continue to carve out an Ascending Triangle pattern.
With the RSI holding above 50 and prices travelling firmly above all four moving averages, further gains look in the offing.
Gaining a firm foothold above the October 9 daily close (80.50) is probably required to carve a path for prices to probe August high (81.58) resistance.
Breaking above that would likely validate the bullish Ascending Triangle pattern and bring the 61.8% Fibonacci (82.61) into the cross hairs.
Conversely, slipping back below the July high (80.14) could neutralize near-term buying pressure and generate a correction towards the November 2 daily close (79.18).
CAD/JPY daily chart created using Tradingview
-- Written by Daniel Moss, Analyst for DailyFX
Follow me on Twitter @DanielGMoss

