British Pound, Bank of England, Vaccination Rates, GBP/JPY, GBP/USD – Talking Points:
- Equity markets climbed higher during APAC trade as the Fed’s dovish stance overnight firmed market sentiment.
- A cautiously optimistic outlook from the Bank of England may buoy the British Pound against its major counterparts.
- The long-term technical outlook for GBP/USD and GBP/JPY remains overtly bullish however, is a short-term pullback in the offing?
The Quiz
Discover what kind of forex trader you are
Asia-Pacific Recap
Equity markets broadly gained during Asia-Pacific trade as the Federal Reserve confirmed that it would keep interest rates at current levels through 2023. Japan’s Nikkei 225 soared 1.01%, Hong Kong’s Hang Seng Index surged 1.56%, and China’s CSI 300 jumped 0.42%. Australia’s ASX 200 dipped 0.73% lower despite strong employment figures, as yields on Federal government bonds spiked 7-basis points higher.
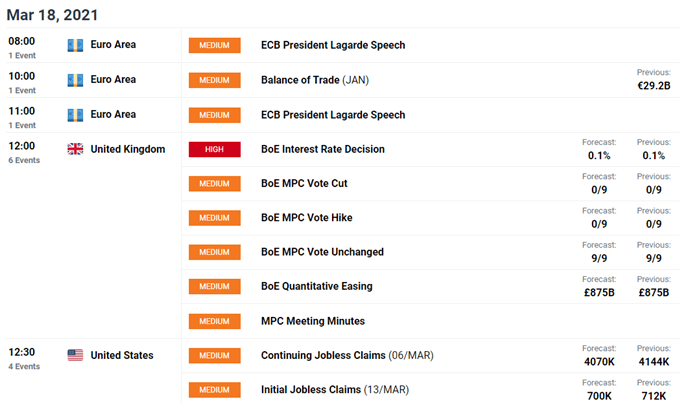
In FX markets, the risk-sensitive Australian, New Zealand and Canadian Dollars largely outperformed while the haven-associated US Dollar, Swiss Franc and Japanese Yen lost ground. Gold and silver prices gained as yields on US 10-year Treasuries held relatively steady at 1.66%. Looking ahead, the Bank of England rate decision headlines the economic docket, alongside jobless claims data out of the US.
Optimistic BoE to Buoy British Pound
The Bank of England’s upcoming monetary policy meeting may pave the way for the British Pound to extend its climb higher against its haven-associated counterparts, given the diminished prospect of further easing amid a rapidly improving fundamental backdrop.
The expeditious distribution of coronavirus vaccines has allowed the United Kingdom to move to stage one of the four stage reopening plan introduced by Prime Minister Boris Johnson’s government, which sees the return of in-class schooling this month, followed by the reopening of outdoor hospital settings in mid-April, sporting venues in mid-May, and all other businesses by June.
Moreover, the supply of an additional 10 million doses of AstraZeneca’s vaccine will likely see the inoculation rate double in the coming weeks, and may potentially allow all adults to receive their first shot by the start of June. This suggests that the nation may return to a level of normality by the middle of the year.
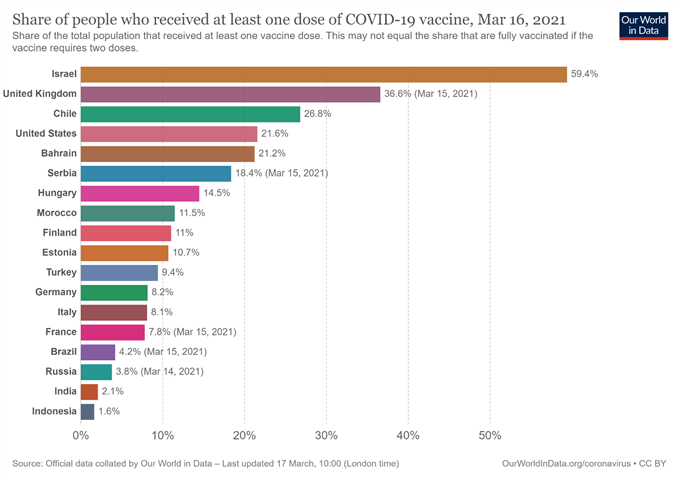
Moreover, recent fundamental data has been relatively positive, with January GDP showing that the nation’s economic output contracted drastically less than expected estimates.
Therefore, a cautiously optimistic stance from the BoE will probably buoy GBP in the near term, and may even lead to market participants pricing in the tapering of Quantitative Easing purchases in the coming months.
However, it must be noted, that this seems unlikely at the upcoming meeting, given the commentary from several central bank members reiterating that the path forward for the local economy remains highly uncertain.
GBP/USD Weekly Chart – Probing 2007 Downtrend
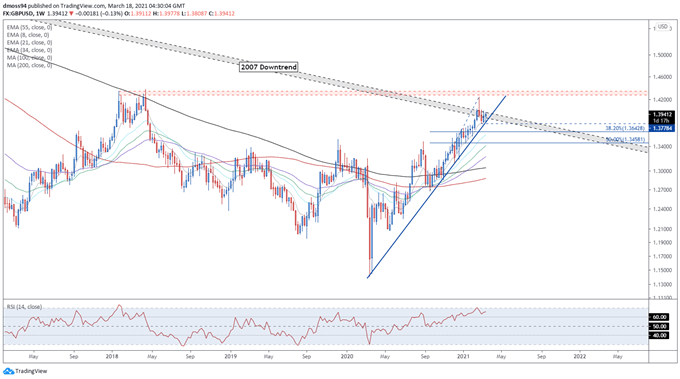
GBP/USD weekly chart created using Tradingview
From a technical perspective, the outlook for the GBP/USD exchange rate remains overtly bullish, a price tracks firmly above all six moving averages, and begins to consolidate above key psychological support at 1.3900.
The formation of a Golden Cross moving average formation, in tandem with the RSI eyeing a push into overbought territory, is also indicative of swelling bullish momentum.
A weekly close above the February 22 open (1.4011) would probably intensify near-term buying pressure and generate an impulsive push to challenge range resistance at 1.4280 – 1.4340.
However, if the psychological imposing 1.4000 mark stay intact, a short-term pullback to the 8-EMA (1,3841) could be on the cards, with a break below that likely bringing the 38.2% Fibonacci (1.3643) into the crosshairs.
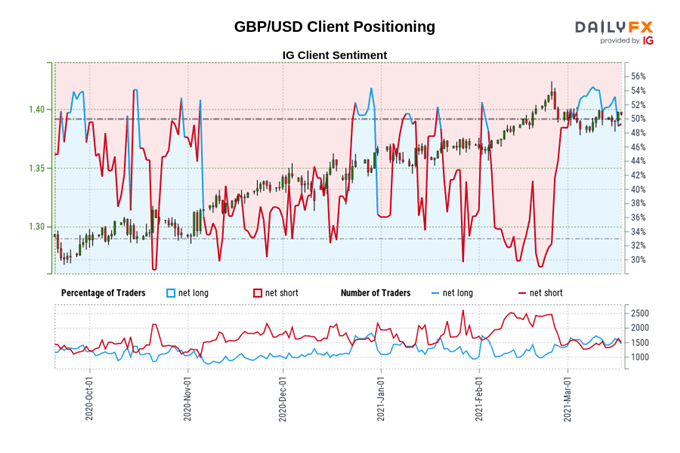
The IG Client Sentiment Report shows 50.08% of traders are net-long with the ratio of traders long to short at 1.00 to 1. The number of traders net-long is 3.94% lower than yesterday and 10.37% lower from last week, while the number of traders net-short is 8.61% lower than yesterday and 6.57% higher from last week.
We typically take a contrarian view to crowd sentiment, and the fact traders are net-long suggests GBP/USD prices may continue to fall.
Positioning is more net-long than yesterday but less net-long from last week. The combination of current sentiment and recent changes gives us a further mixed GBP/USD trading bias.
GBP/JPY Weekly Chart – Symmetrical Triangle Break Hints at Further Gains
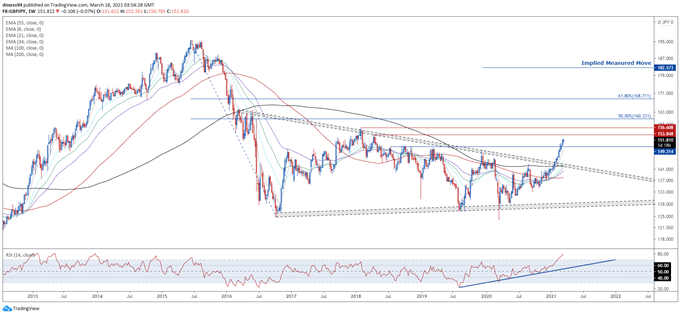
GBP/JPY weekly chart created using Tradingview
GBP/JPY rates also look poised to drastically extend recent gains over the longer-term, as prices slice through Symmetrical Triangle resistance and psychological resistance at 151.00.
With the RSI storming into overbought territory for the first time in 6 years, and a bullish Golden Cross formation taking place on the moving averages, an extended move higher seems relatively likely.
However, there is a risk that the recent surge to multi-year highs is overextended and could be at risk of a short-term pullback.
Failing to gain a firm foothold above 152.00 could open the door for sellers to drive the exchange rate back towards former resistance-turned-support at 149.30.
On the other hand, clearing 152.00 may bring the April 2018 high (153.85) into the crosshairs.
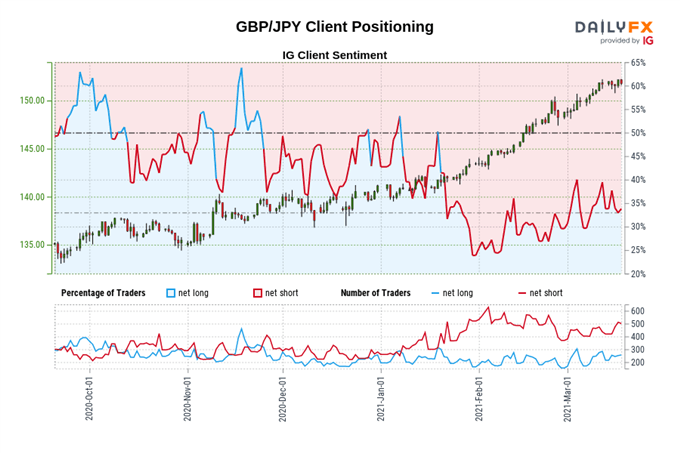
The IG Client Sentiment Report shows 35.25% of traders are net-long with the ratio of traders short to long at 1.84 to 1. The number of traders net-long is 9.09% higher than yesterday and 3.16% lower from last week, while the number of traders net-short is 2.50% lower than yesterday and 10.46% higher from last week.
We typically take a contrarian view to crowd sentiment, and the fact traders are net-short suggests GBP/JPY prices may continue to rise.
Positioning is less net-short than yesterday but more net-short from last week. The combination of current sentiment and recent changes gives us a further mixed GBP/JPY trading bias.
-- Written by Daniel Moss, Analyst for DailyFX
Follow me on Twitter @DanielGMoss

