British Pound, GBP, GBP/USD, GBP/JPY, EUR/GBP Talking Points:
- GBP/USD put in a two-week streak-of-strength but ran into a wall of resistance earlier this week.
- While USD may have a fairly chaotic backdrop around the election, there may be more compelling setups on either side of Sterling by looking towards GBP/JPY and EUR/GBP.
- The analysis contained in article relies on price action and chart formations. To learn more about price action or chart patterns, check out our DailyFX Education section.
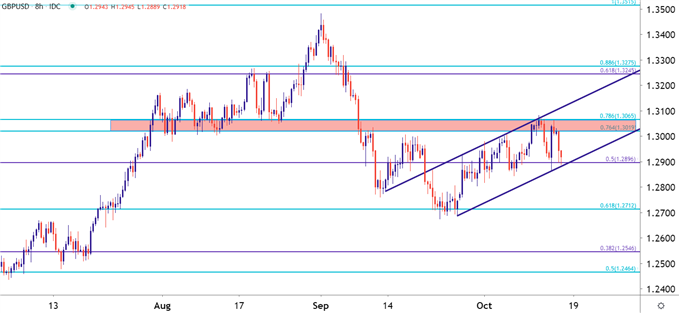
While the headlines have been far from joyful reading in the UK of recent, one might not know better if looking at the GBP/USD chart coming into this week. The British Pound looked downright strong after testing a big spot of support in late-September, and this led to a two-week-rally that held through this week’s open.
I had looked at that support zone in late-September, with GBP/USD gearing up for yet another test of the 1.3000 psychological level. That test has so far failed as prices have pulled back, attempting to cauterize yet another area of higher-low support. Helping to hold the lows over the past two days is a key area of support just below the 1.2900 handle, as 1.2896 is the 50% marker of the 2018-2020 major move in the pair. Also of relevance are the 76.4 and 78.6% Fibonacci retracements of the December-March major move, as these prices have now helped to hold multiple resistance inflections so far this week; and this comes after a fairly clear show of support in the same area in the first-half of August.
GBP/USD Eight-Hour Price Chart

Chart prepared by James Stanley; GBPUSD on Tradingview
The above chart can be construed in either a bullish or bearish manner. On the bullish side, the focus would be on the series of higher-highs and lows that’s built-in since late-September, going along with a support inflection at a familiar level.
However, this may be a brewing bear flag with that bullish theme merely a corrective portion of a bigger-picture bearish picture. This argument would be supported by the fact that the bullish trend ran into a brick wall of support around the 1.3000 resistance items.
Also of consideration – the US Dollar is going through its own themes at the moment as we get closer and closer to the election. For traders looking to take-on exposure in the British Pound, there may simply be more amenable pastures elsewhere, which I’ll look at below.
GBP/JPY Tests Big Support
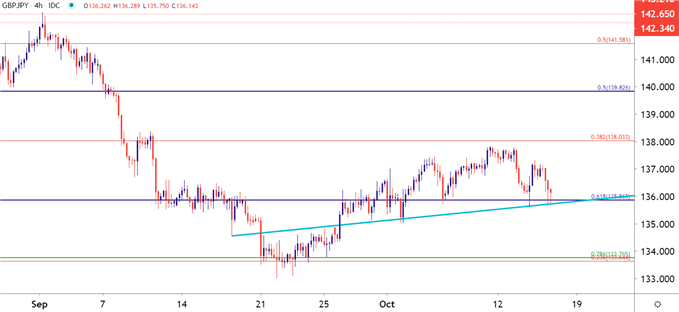
If looking for long-GBP exposure, GBP/JPY may present a compelling argument. Similar to GBP/USD above, the pair dug-out of support in late-September before going on a two-week-run of strength. That strength continued through this week’s, with sellers showing up on Tuesday to push price action back down to a key area of support.
The support here is defined by the 61.8% retracement of the 2016-2018 major move; and this level has already seen numerous inflections – on either side – so far in 2020 trade. Given the longer-term scope of this support, it may be a bit more attractive than the support looked at above in GBP/USD. And if buyers can hold the lows here through today, with respect to yesterday’s swing-low, the door can remain open for topside strategies in the pair.
GBP/JPY Four-Hour Price Chart

Chart prepared by James Stanley; GBPJPY on Tradingview
EUR/GBP Presents Compelling Scenario for GBP-Weakness
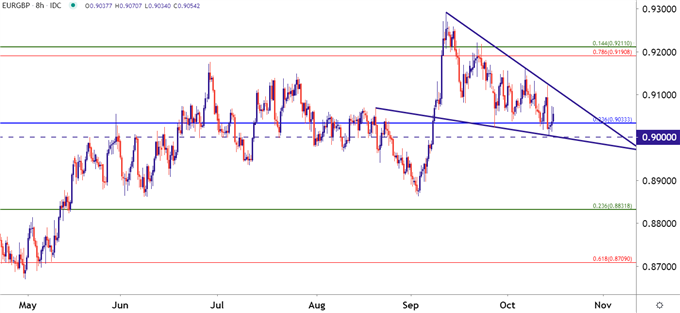
For those looking for short-GBP exposure, there may be some brewing opportunity around EUR/GBP. The pair jumped up to a fresh high in early-September but it’s been a slow grind lower ever since. Along the way, a key observation has presented itself, which is the fact that sellers in the pair have been far more aggressive around highs or at resistance than what’s shown around support.
This has allowed for the build of a falling wedge pattern, which will often be approached with the aim of bullish reversals. When this pattern is incorporated with the .9000 psychological level sitting just underneath price, along with the .9033 Fibonacci level, there could be multiple reasons for buyers to defend support here. This can keep the door open for bullish breakout potential in the pair and this would be one of the more interesting ways to investigate GBP-weakness given current dynamics.
To learn more about the falling wedge pattern, check out our chart patterns section within DailyFX Education.
EUR/GBP Eight-Hour Price Chart

Chart prepared by James Stanley; EURGBP on Tradingview
--- Written by James Stanley, Strategist for DailyFX.com
Contact and follow James on Twitter: @JStanleyFX

