GBP/USD, GBP/JPY, Bank of England, Europe Open – Talking Points:
- A timid start to a fresh month of trade during APAC trade, with risk-sensitive assets tracking broadly lower
- GBP/USD decline may continue as Brexit fears, weak economic data sours sentiment
- GBP/JPY poised to move lower after temporary recovery was snuffed out at resistance.
Asia-Pacific Recap
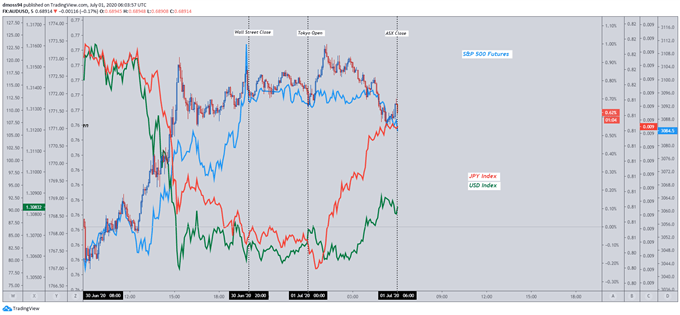
Risk appetite seemed to fade throughout Asia-Pacific trade with the haven-linked US Dollar and Japanese Yen rising at the expense of the sentiment-sensitive Australian Dollar. S&P 500 futures nudged slightly lower whilst gold continued its impressive run of setting fresh yearly highs each month this year as it climbed back above 1,780.
Caixin PMI data out of China did little to fuel market optimism despite beating expectations, as the pace manufacturing growth hit a 6-month high. The ASX 200 outperformed the majority of its Asia-Pacific counterparts on the back of the possible introduction of further stimulus measures, whilst the Nikkei 225 fell over 1% after the Bank of Japan’s Tankan index collapsed to an eleven-year low.
Looking forward, final manufacturing PMI prints for France and Germany will be of interest to assess the progress of the economic rebound in the European Union. US ADP employment numbers are likewise on tap.

Market reaction chart created using TradingView
Record Contraction and Lack of Spending Spells Danger for the UK
The British Pound seems to be suffering from a combination of Brexit uncertainty and disappointing economic data as it continues to lag behind its G10 counterparts.
Prime Minister Boris Johnson’s decision to stick to the current Brexit timeline has significantly upped the ante for the Conservative-led government, as failure to ratify a formal trade deal with the European Union by December 31 could prove disastrous for the island nation.
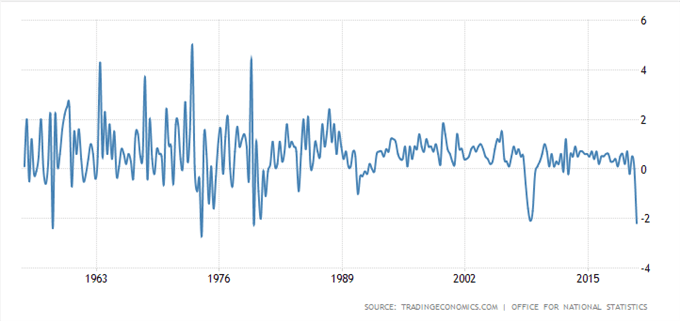
Moreover, with the local economy shrinking 2.2% in the first quarter of 2020 – the most since 1979 – the near-term outlook remains gloomy at best as the staggering 2.9% drop in household consumption may confirm Bank of England Chief Economist Andy Haldane’s fears of a “negative feedback loop”.
United Kingdom Quarterly GDP Growth Rate

Described in Haldane’s second quarter recap, this harps back to John Maynard Keyne's concept of the “paradox of thrift” coined during the Great Depression of the 1930s; called so “because prudent decisions by households have the perverse collective consequence of increasing risks to the economy and those same individuals”.
As has been stated by various central bankers around the world, from the Federal Reserve to the Reserve Bank of Australia, the return of consumer confidence will determine the speed and strength of the economic recovery.
In the case of the UK, uncertainty is resulting in an “increase in precautionary savings” and a decrease in household consumption.
This is a tell tale sign of more hurt to come for the United Kingdom if it fails to incentivize its citizens to, in the words of PM Boris Johnson, “Spend! Spend! Spend!”
GBP/USD – Descending Channel Contains Bullish Potential

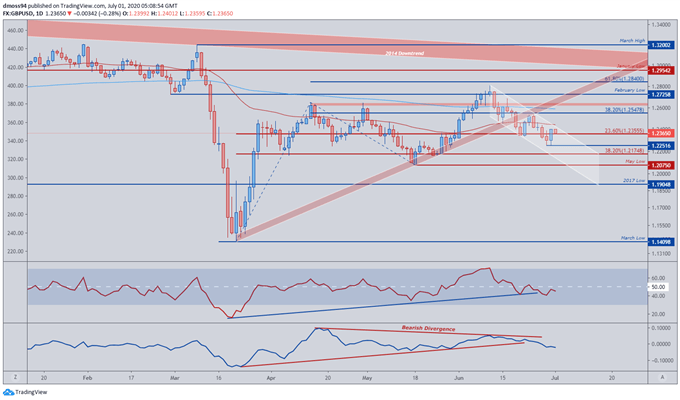
GBP/USD daily chart created with TradingView
GBP/USD looks poised to clear support at the June low (1.2252) after the 200-day moving average snuffed out the bullish surge on the last day of the month.
Descending Channel resistance may continue to corral price, forcing the British Pound back to the 38.2% Fibonacci (1.2175) and bullish invalidation level at the May low (1.2075).
Moreover, the fading strength of both the RSI and Momentum oscillators compounds the downside bias reflected in price and could fuel a more sustained, prolonged correction.
A daily close below the May low (1.2075) would be pivotal for bears, possibly carving a path back to the March low (1.1410) should price leapfrog support at the 2017 low (1.1905).
GBP/JPY Daily Chart – 50-DMA Proving a Challenge for Buyers

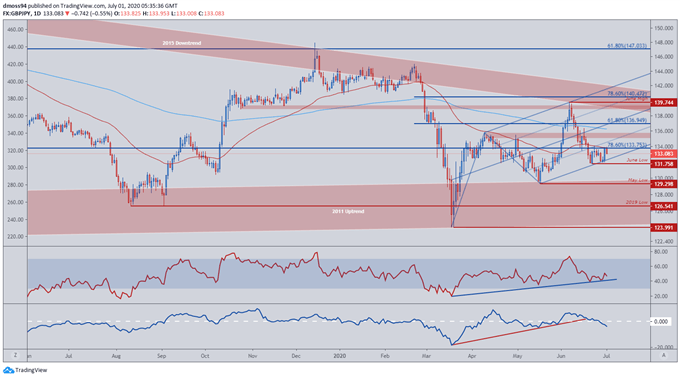
GBP/JPY daily chart created using TradingView
GBP/JPY also struggled to overcome the 50-DMA (1.3388) despite a surge of buying pressure at pitchfork parallel support.
The convergence of the 50-DMA and 78.6% Fibonacci may continue to cap potential upside whilst the development of both technical indicators signal the path of least resistance may be to the downside.
A daily close below the June low (131.76) may invigorate sellers, opening up the possibility of a revisit to the May low (129.30) and upper bounds of the 2011 uptrend.
On the other hand, the RSI may give hope to GBP bulls should price remain contained within the confines of the ascending Pitchfork. However, a close above the resistance zone at the April high (135.00 – 135.50) would be needed to validate bullish potential.
-- Written by Daniel Moss, Analyst for DailyFX
Follow me on Twitter @DanielGMoss

