British Pound, GBP/USD, GBP/JPY, Coronavirus Restrictions, Tier 4 Lockdowns – Talking Points:
- Equity markets broadly lost ground during APAC trade as climbing US real yields weighed on global risk assets.
- The potential tightening of coronavirus restrictions may undermine the British Pound in the coming days.
- GBP/USD at risk of further losses after slipping back below 8-EMA.
- GBP/JPY could slide lower as price fails to breach key resistance.
Asia-Pacific Recap
Equity markets broadly lost ground during Asia-Pacific trade as investors weighed the impact of the notable spike in US Treasury yields on global risk assets. Australia’s ASX 200 index fell 0.9% despite better-than-expected retail sales data for November, while China’s CSI 300 index slipped 1.03% amid a fresh outbreak of coronavirus cases on the mainland.
In FX markets, the haven-associated USD and JPY largely outperformed, while the cyclically-sensitive AUD, NZD and NOK slid lower. Gold and silver prices extended their respective declines despite yields on US 10-year Treasuries holding relatively steady.
Looking ahead, speeches from European Central Bank President Christine Lagarde and Atlanta Fed President Raphael Bostic headline a rather light economic docket.

Tighter Restrictions to Undermine GBP
The British Pound may come under pressure in the near term as UK lawmakers consider tightening coronavirus restrictions further in response to a relentless surge in local infections. Despite Prime Minister Boris Johnson’s government imposing tier 4 restrictions on 80% of the population at the end of December, the 7-day moving average tracking infections has soared to just shy of 60,000.
In fact, new modelling suggests that a staggering 1 in 5 people in England have now contracted Covid-19, with the latest viral R rate climbing to 1.4 across the UK. An R rate above 1.0 implies that the virus will continue to spread exponentially.
These worrying developments have led to ministers questioning whether the latest lockdown is being adhered to by local residents, and could ultimately lead to the introduction of restrictions more in line with those seen in March 2020.
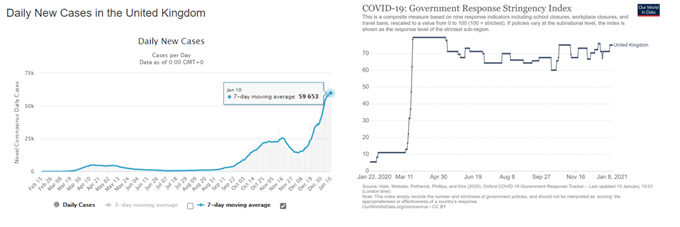
Sources – Worldometer, Our World in Data
Indeed, Health Secretary Matt Hancock failed to rule out whether or not more draconian measures may be enforced in the coming days, stating that “I don’t want to speculate, because the most important message is not whether the Government will further strengthen the rules, the most important thing is that people stay at home and follow the rules that we’ve got”.
Although this is hardly a declaration that additional tightening is around the corner, the Health Secretary’s refusal to rule out further curbs may undermine regional risk sentiment and in turn lead to a notable discounting of the British Pound against its major counterparts.
GBP/USD Daily Chart – 8-EMA May Guide Price Lower
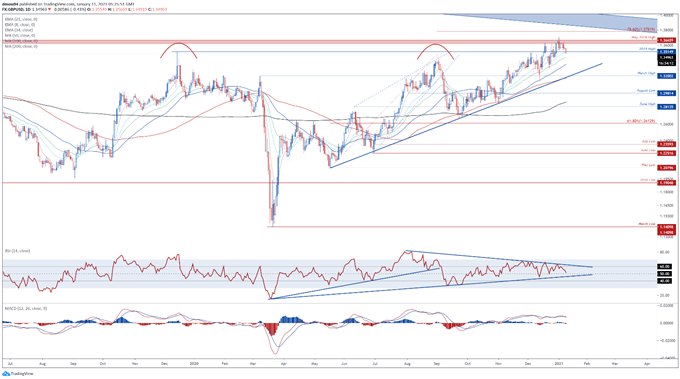
GBP/USD daily chart created using Tradingview
From a technical perspective, GBP/USD appears poised to extend its recent slide lower, as prices slide back below the 8-day exponential moving average (1.3551) and support at the 2019 high (1.3515).
A bearish crossover on the MACD indicator, in tandem with the RSI continuing to respect the downtrend extending from the August extremes, also suggests the path of least resistance is lower in the near term.
A daily close below the 21-day EMA (1.3500) would probably neutralize short-term buying pressure and clear a path for sellers to challenge the 50% Fibonacci (1.3419).
Hurdling that likely bringing confluent support at the trend-defining 50-MA and 61.8% Fibonacci (1.3352) into the crosshairs.
Alternatively, pushing back above the psychologically imposing 1.3500 mark could inspire a rebound back towards the monthly high (1.3704).
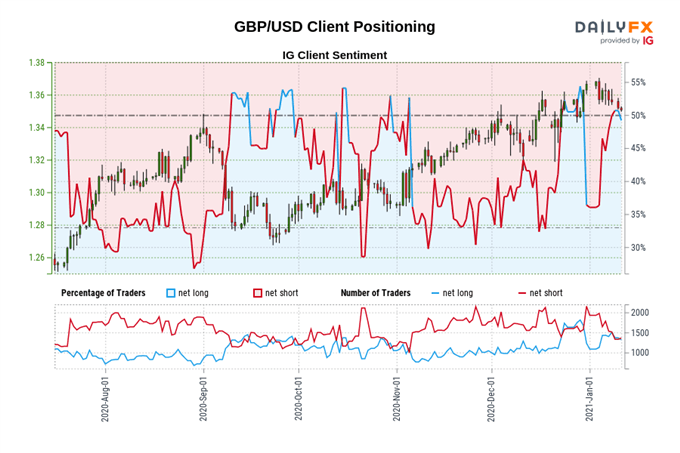
The IG Client Sentiment Report shows 50.29% of traders are net-long with the ratio of traders long to short at 1.01 to 1. The number of traders net-long is 1.90% higher than yesterday and 17.09% higher from last week, while the number of traders net-short is 3.54% higher than yesterday and 30.56% lower from last week.
We typically take a contrarian view to crowd sentiment, and the fact traders are net-long suggests GBP/USD prices may continue to fall.
Positioning is less net-long than yesterday but more net-long from last week. The combination of current sentiment and recent changes gives us a further mixed GBP/USD trading bias.
GBP/JPY Daily Chart – Pitchfork Median Capping Upside
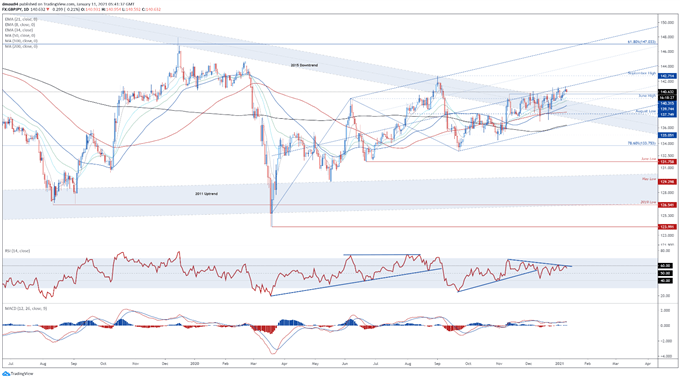
GBP/JPY daily chart created using Tradingview
GBP/JPY rates may also slip lower in the coming days as prices struggle to push above the Schiff Pitchfork median and 141.00 mark.
A daily close back below the November high (140.31) and 8-EMA would probably ignite a pullback towards the monthly low (139.51). Piercing through that likely paving the way for price to probe the trend-defining 50-MA (138.85).
On the other hand, remaining constructively perched above the 8-EMA could allow buyers to drive the exchange rate back towards the January 8 high (141.37), with a break above carving a path to test the September 2020 high (142.71).
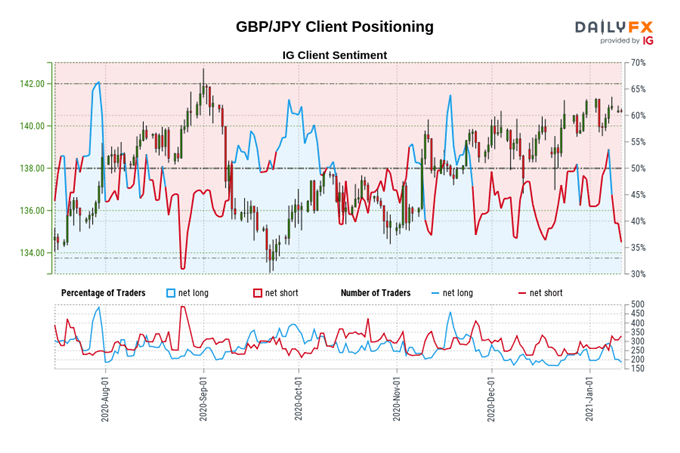
The IG Client Sentiment Report shows 35.86% of traders are net-long with the ratio of traders short to long at 1.79 to 1. The number of traders net-long is 3.00% lower than yesterday and 8.92% lower from last week, while the number of traders net-short is 13.40% higher than yesterday and 31.44% higher from last week.
We typically take a contrarian view to crowd sentiment, and the fact traders are net-short suggests GBP/JPY prices may continue to rise.
Traders are further net-short than yesterday and last week, and the combination of current sentiment and recent changes gives us a stronger GBP/JPY-bullish contrarian trading bias.
-- Written by Daniel Moss, Analyst for DailyFX
Follow me on Twitter @DanielGMoss

