

EUR /JPY and USD/JPY Technical Analysis
- Euro and US Dollar price action against Japanese Yen
- EUR/JPY and USD/JPY charts and analysis
See Our latest trading guides for free and discover what is likely to move the markets through Q4 of this year.
USDJPY, EURJPY – Closed in the Green
Last week Japanese Yen price softened significantly against Euro and US Dollar. On Friday, EUR/JPY closed with nearly 2.0% gain. Similarly, USD/JPY closed the weekly candlestick with a 1.5% gain.
Alongside this, the Relative Strength Index (RSI) crossed above 50 on both pairs highlighting the end of the downtrend momentum.
Having trouble with your trading strategy? Need a hand? Here’s the #1 Mistake That Traders Make
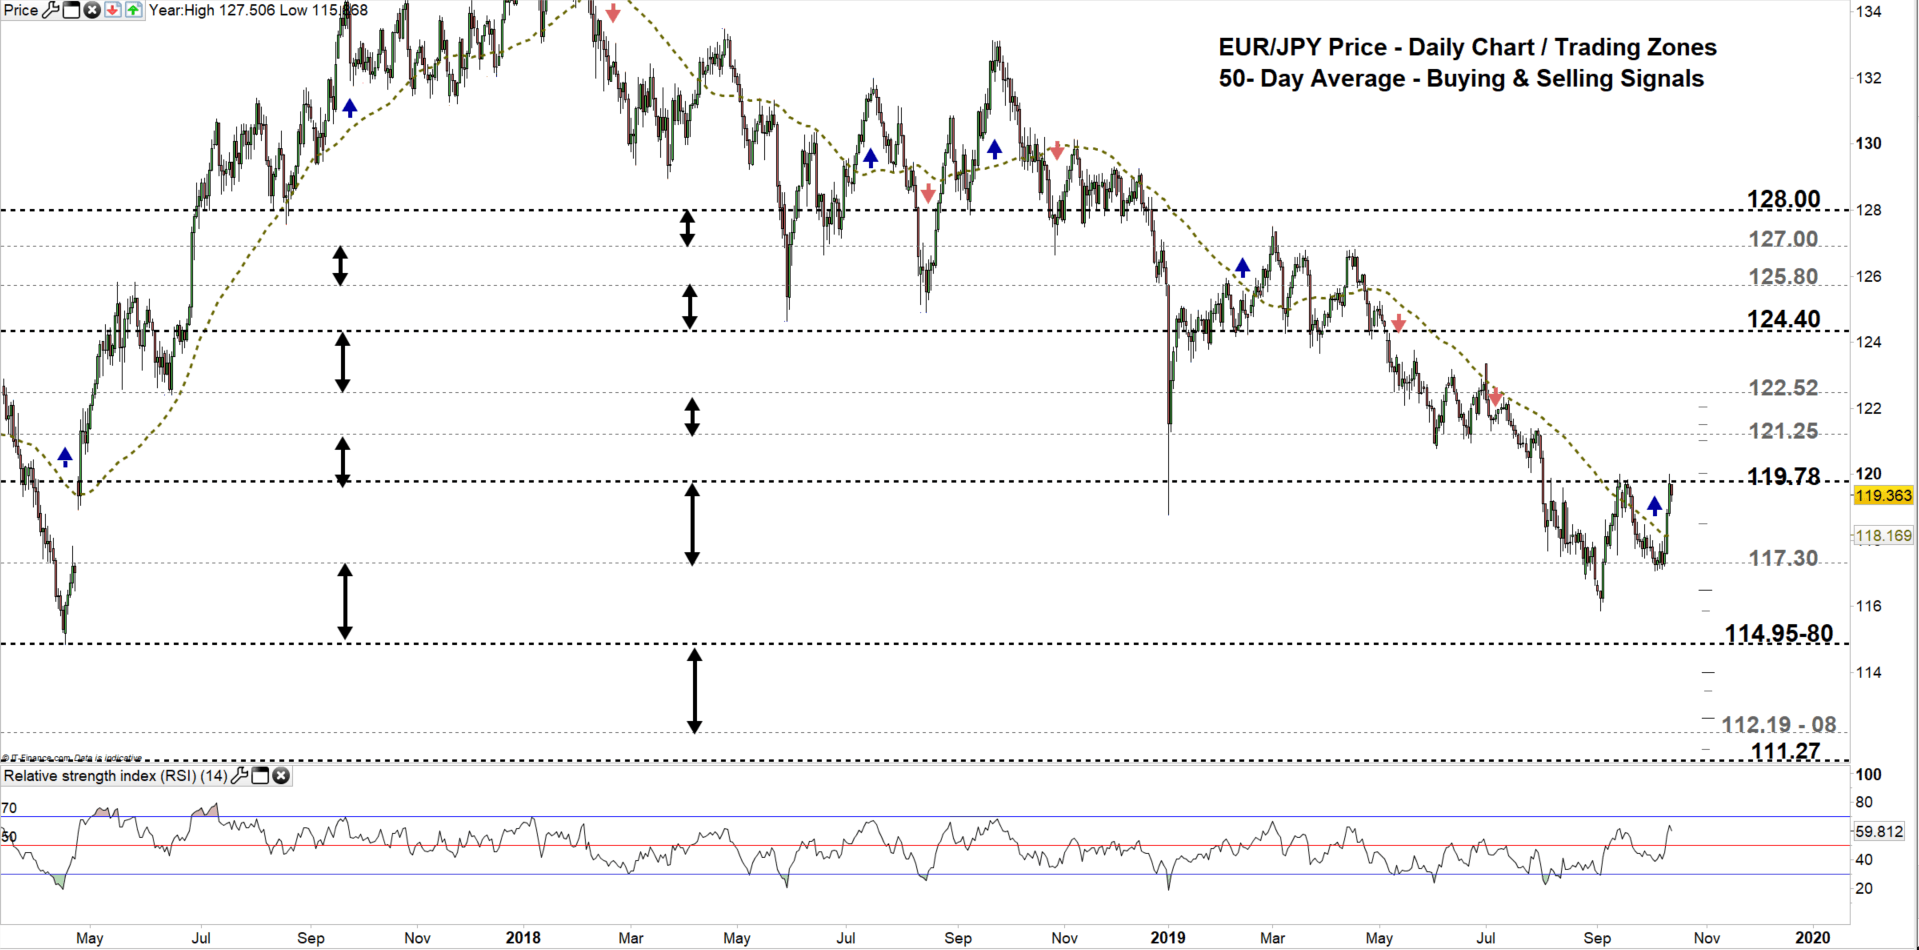
EUR/JPY Daily PRice CHART (Mar 20, 2017 – Oct 14, 2019) Zoomed Out
EUR/JPY Daily Price CHART (AUG 1 – Oct 14, 2019) Zoomed in
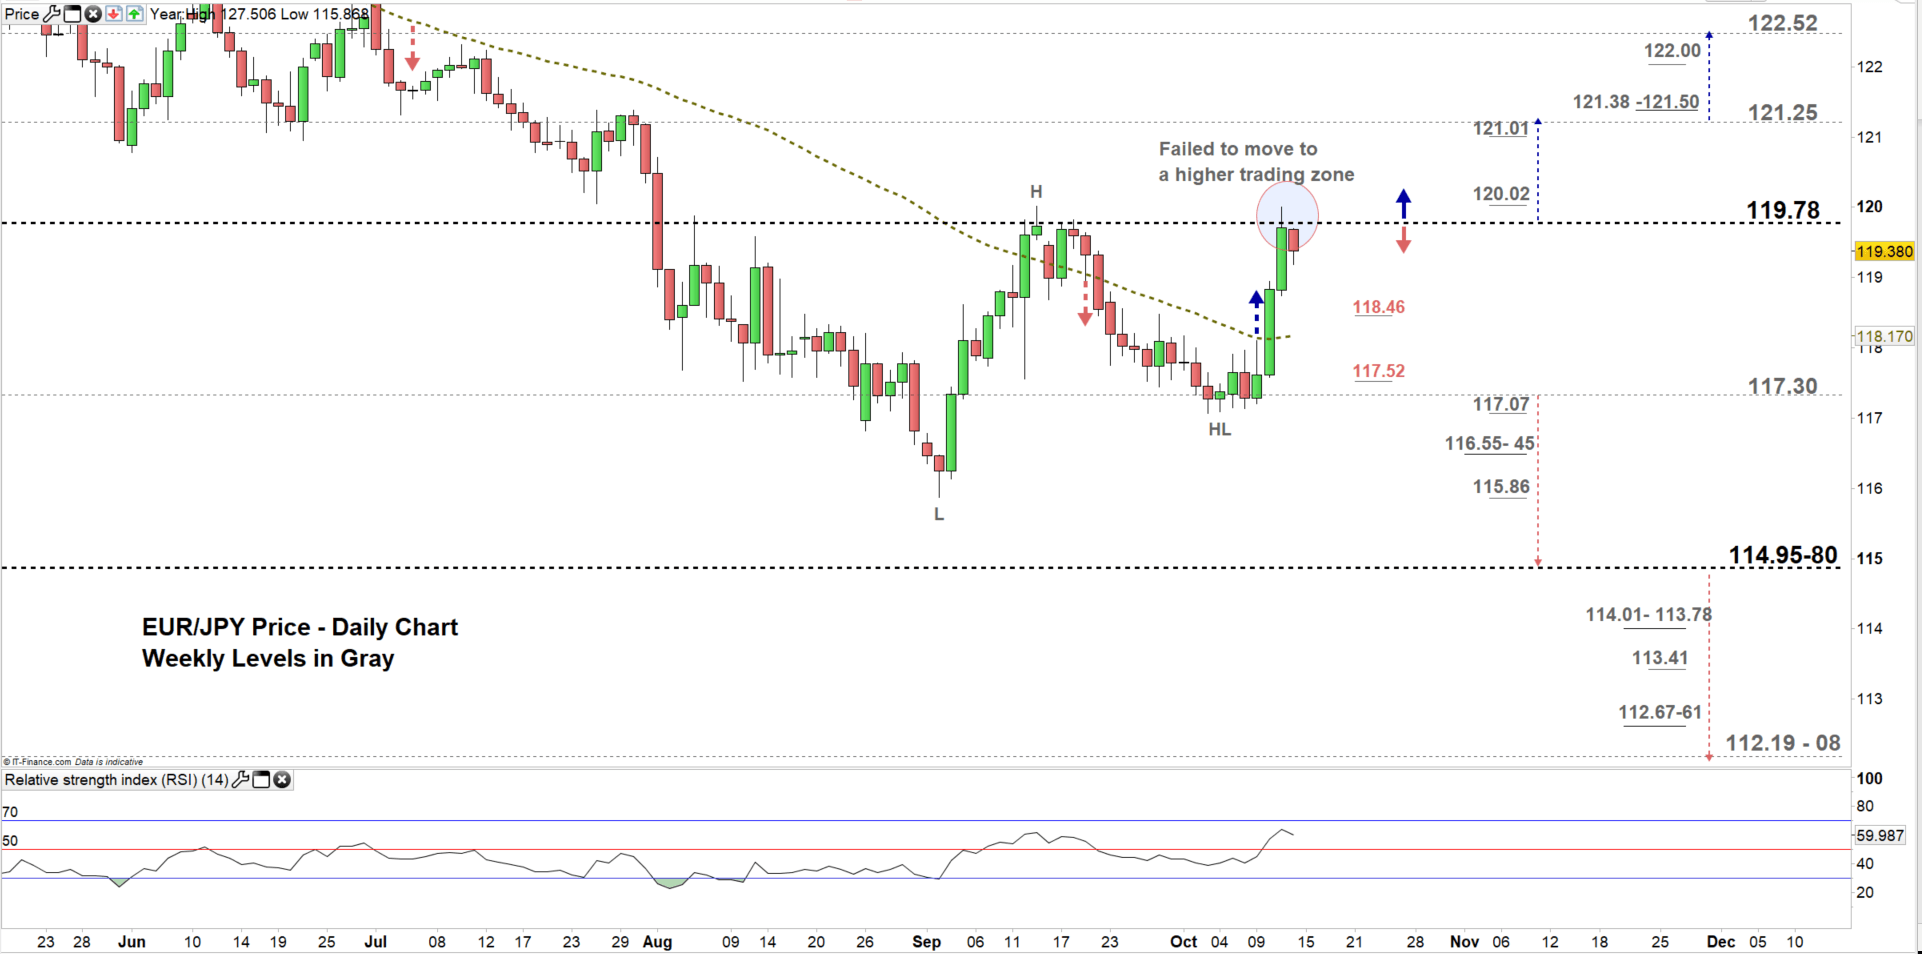
Looking at the daily chart, we notice on Thursday EUR/JPY overtook the 50- Day average. In the following day, the price tested the high end of current trading zone 117.30 – 119.78. However, failed to move to a higher trading zone.
Thus, a close above the high end of the zone could send EURJPY towards 121.25. Further close above this level could mean more bullishness towards 122.52. Having said that, the weekly resistance levels and area marked on the chart (zoomed in) should be considered.
On the flip-side, if buyers were not successful at pushing EURJPY to close above the high end of the zone, this suggest the price may change its direction and decline towards the low end of the zone. Further close below the low end could see more bearishness towards the vicinity of 114.95-80. Although, the daily and weekly support levels underlined on the would be worth monitoring.
Just getting started? See our Beginners’ Guide for FX traders
USD/JPY Daily PRice CHART (April 20, 2017– Oct 14, 2019) Zoomed Out

USD/JPY Daily PRice CHART (June 19 – Oct 14, 2019) Zoomed In

From the daily chart, we notice at the start of last week USD/JPY rallied above the 50-Day moving average, then on Thursday moved to a higher trading zone 107.30 – 108.61. On Friday, the price rebounded nearby the high end of the zone, similarly to EUR/JPY.
Hence, a close above the high end of the zone could see USDJPY trading even higher towards the vicinity of 109.75-84. Further close above 109.75 may push the price towards 110.48-52. That said, the weekly resistance levels underlined on the chart (zoomed in) should be watched along the way.
In turn, another failure in closing above the high end could reverse the price’s direction sending USDJPY towards the low end of the zone contingent on clearing the daily support levels marked on the chart. Further close below the low end may see USDJPY tumbling towards 105.50. Although, the weekly support area and level marked on the chart should be kept in focus.
Written By: Mahmoud Alkudsi
Please feel free to contact me on Twitter: @Malkudsi