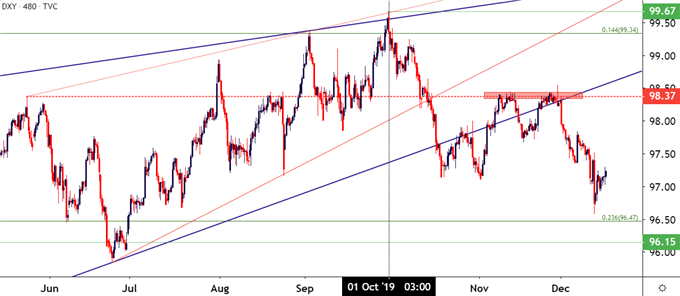
US Dollar weakness showed up in October of this year, coming after what had been a generally upbeat and positive nine-month-outlay in the USD even as the Federal Reserve began to cut rates. In what appeared to be an almost defiant move of strength in the currency, the US Dollar gained through September trade as the Fed was talking up the prospect of lower rates and softer policy. The Fed posed their third and final 2019 cut in late-October, but when doing so framed their stance as one of pause as they said that they weren’t looking to cut or hike rates anytime in the near future. This led to a mild bounce in the month of November that was quickly priced-out of the equation in December as the currency fell to a fresh five-month-low.
US Dollar Eight-Hour Price

Chart Chart prepared by James Stanley
US Dollar Q4 Performance: The Reversal Begins
With 2019 coming to a close, the US Dollar is holding on to a one-percent gain from the yearly open, as of this writing. This is lighter than the +3.67% gain that the currency had put in up to the yearly high that was set on the first trading day of Q4. Coming into Q4, the bearish side of the US Dollar was looked at in our prior technical forecast, driven by a rising wedge pattern that will often be approached with the aim of bearish reversals. It was perhaps the ‘why’ that formation had built that the setup remained so interesting, as each flicker of strength in the USD to fresh highs was often coupled with a tweet from President Trump pertaining to the Fed or rate policy or just the fact that the Dollar was too strong. The passiveness around resistance or at highs coupled with an aggressive reaction from bulls at support is what led to the build of the formation; and as Q4 trade began the sellers came out, with force, to push the currency lower.

