EUR/CHF & USD/CHF Technical Analysis
- Euro and US Dollar against Swiss Franc Price Charts
Did you check our latest forecasts on USD and EUR and Gold? Find out more for free from our Q4 forecasts for commodities and main currencies
USD/CHF, EUR/CHF – Stuck in a Sideways Move
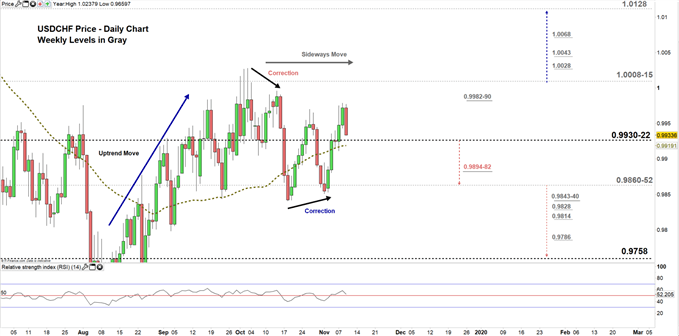
On Nov 1, USD/CHF corrected its downside move and created a higher low at 0.9851. On the following day, the price started a sideways move reflecting reluctance from buyers and sellers to lead the price at this stage.
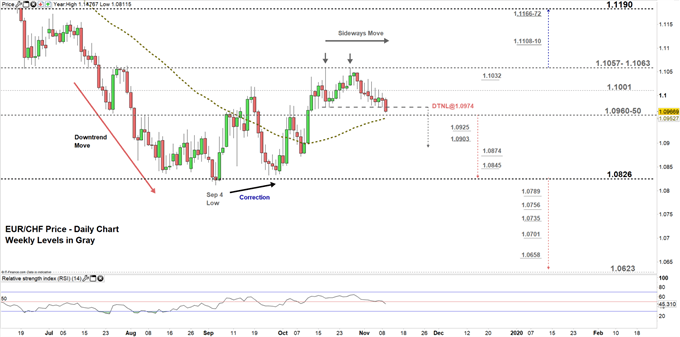
Meanwhile, on Oct 28 EUR/CHF buyers failed to rally the price above 1.1059. This led the pair to stuck in a narrow range in a similar way to USD/CHF.
The Relative Strength Index (RSI) has been moving nearby 50 on both pairs, highlighting the lack of momentum from market’s participants to move the price in a clear direction.
Just getting started?See our Beginners’ Guide for FX traders
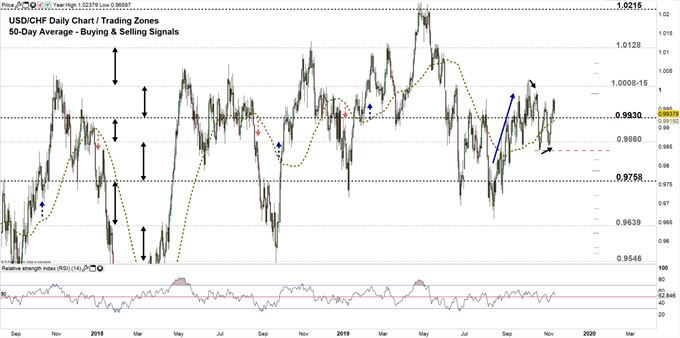
USD/CHF Daily Price Chart (Aug 22, 2017 – Nov 11, 2019) Zoomed Out

USD/CHF Daily Price Chart (July 2 – Nov 11, 2019) Zoomed IN

Looking at daily chart, we notice on Thursday USD/CHF broke above 50-day average then rallied to a higher trading zone 0.9930 – 1.0008. However, the price dropped today eyeing a test of the low end of the zone.
Thus, a close below 0.9922 could send USDCHF towards the vicinity of 0.9860-52. Further close below 0.9852 may see the pair trading even lower towards 0.9758. In that scenario, the daily and weekly support areas and levels marked on the chart (zoomed in) should be kept in focus.
That said, a close above the low end of the aforementioned zone could increase the likelihood of USDCHF to rally towards the high-end contingent on clearing the weekly resistance area underlined on the chart. See the chart to know more about the following trading zone with the weekly resistance levels to consider in a further bullish move.
Having trouble with your trading strategy? Here’s the #1 Mistake That Traders Make
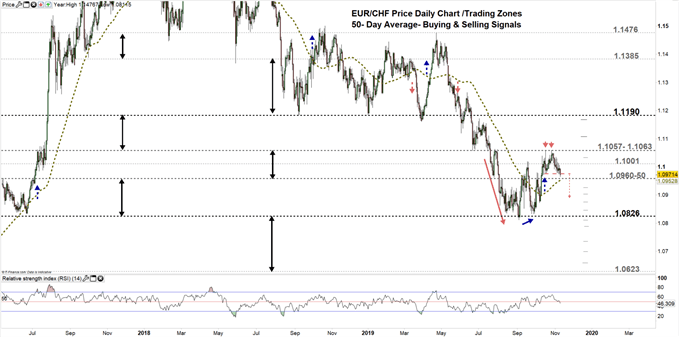
EUR/CHF Daily Price Chart (Aug 10, 2017 – Nov 11, 2019) Zoomed Out

EUR/CHF Daily Price Chart (June 11 – Nov 11, 2019) Zoomed IN

Looking at the daily chart, we notice on Oct 31 EUR/CHF declined to a lower trading zone 1.0960 – 1.1001. Since then, buyers have failed in multiple occasions to force a close above the high end of the zone. Consequently, today sellers have taken advantage and pressed below the neckline of double top pattern residing at 1.0974, eying a test of 1.0900 handle.
A close below the low end of the mentioned above trading zone could end current sideways move and send USDCHF towards 1.0826. Although, the weekly support levels underlined on the chart (zoomed in) should be considered.
On the flip-side, any failure at closing below the low end of the zone would mean more of the same i.e. a push towards the high end of the zone. Further close above the high end could cause a rally towards the vicinity of 1.1057-1.1063. Nevertheless, the weekly resistance level underscored on the chart would be worth monitoring.
Written By: Mahmoud Alkudsi
Please feel free to contact me on Twitter: @Malkudsi

