

Canadian Dollar Outlook
- USD/CAD charts and analysis
- Canadian Dollar price action against US Dollar
Check our latest Q4 forecasts for free and learn what is likely to move the markets at this time of the year.
USD/CAD – Downtrend Still intact
On Oct 29, USD/CAD bounced from 1.3042- its lowest level in over three months. The price rallied after then settled above 1.3100 handle. On Friday, the pair closed in the green for the first time in three weeks.
The Relative Strength Index (RSI) rose from 31 however, has not been able to cross above 50 highlighting buyer’s lack of momentum to kick start uptrend move.
Just getting started?See our Beginners’ Guide for FX traders
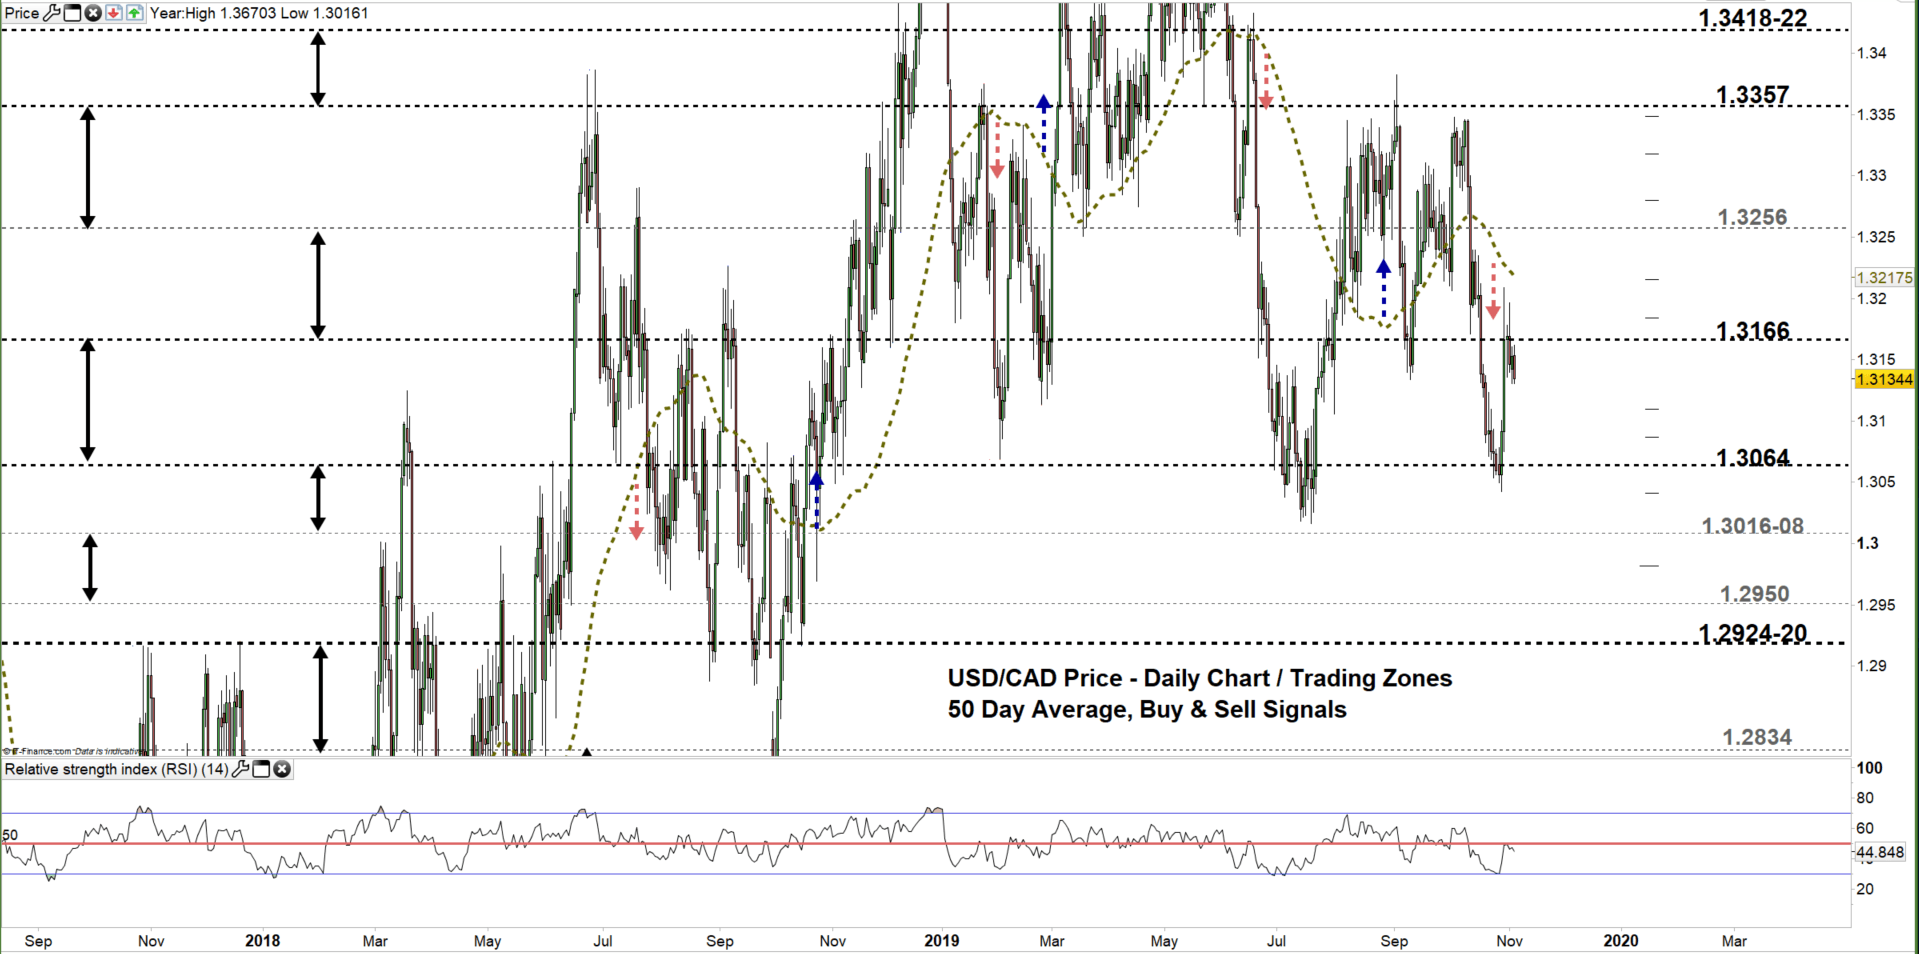
USD/CAD DAILY PRICE CHART (DEC 18, 2017 – Nov 5, 2019) Zoomed Out
USD/CAD DAILY PRICE CHART (July 15– Nov 5, 2019) Zoomed In
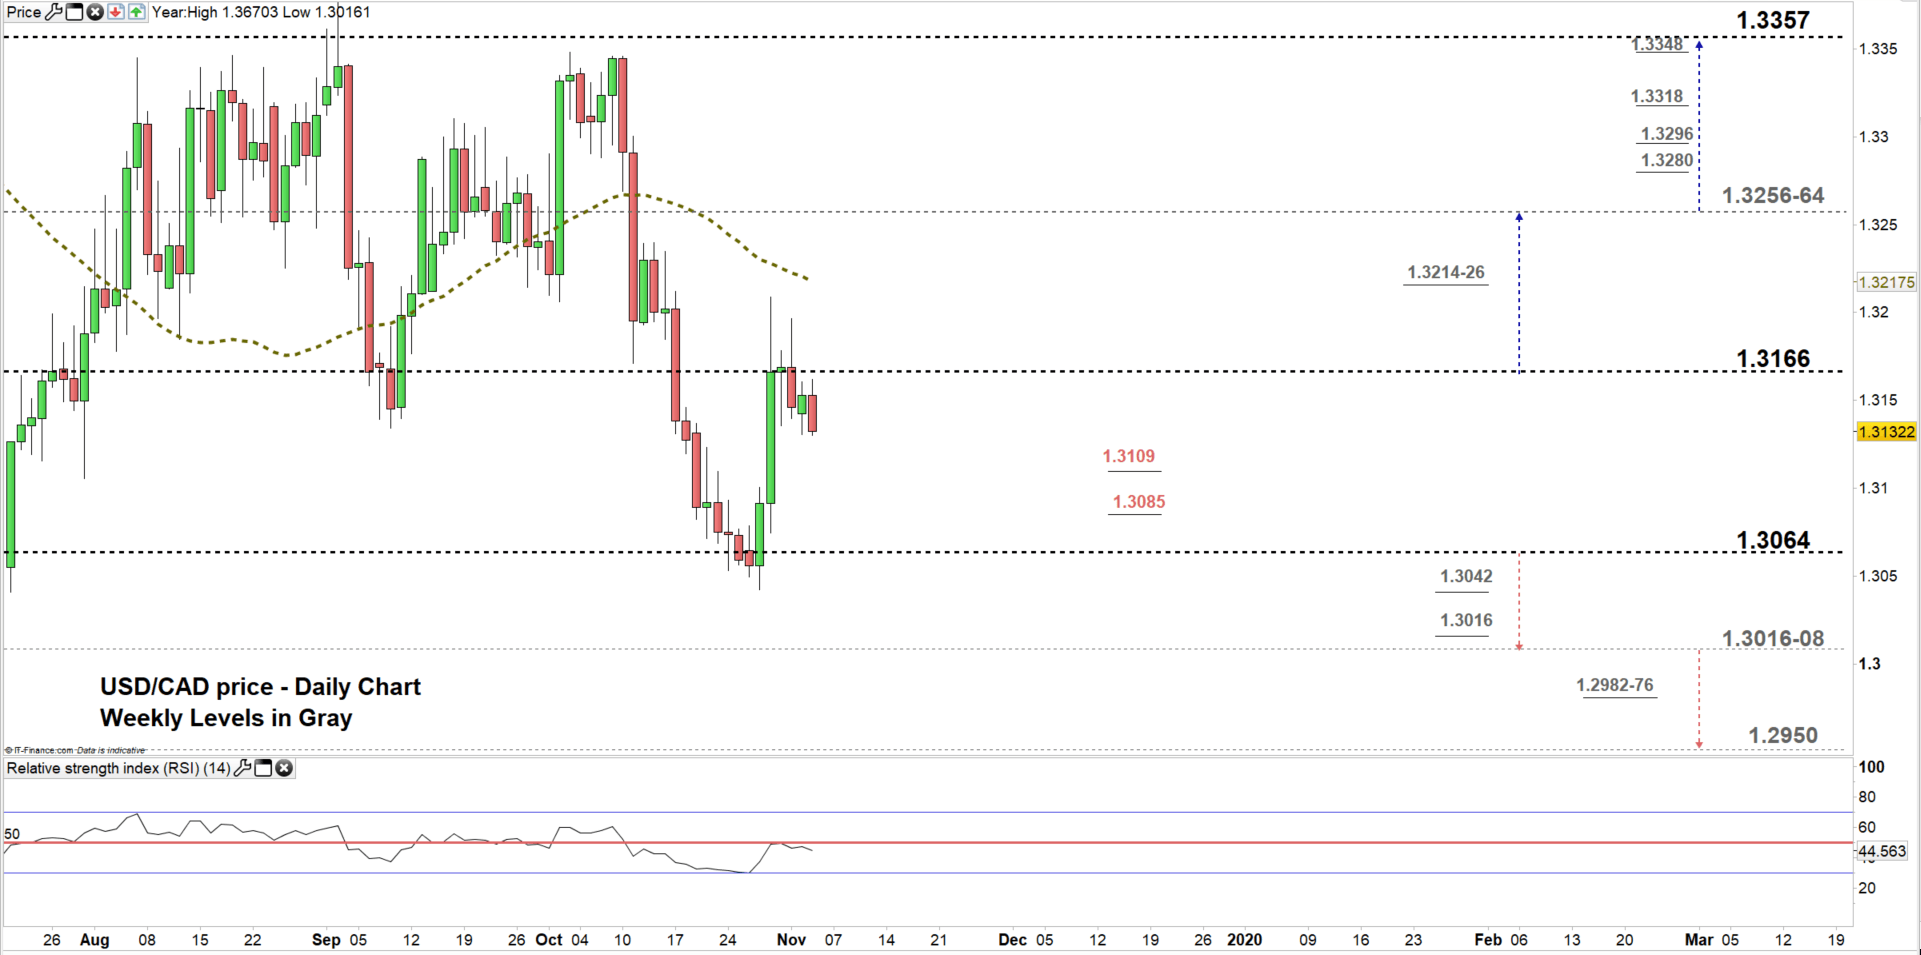
From the daily chart, we notice on Thursday the pair’s rally paused. On the following day, the price decliend to a lower trading zone 1.3064 – 1.3166. Therefore, USD/CAD could be on its way for a test of the low end of the zone.
Further close below the low end of the zone could embolden sellers to press USDCAD lower towards the vicinity of 1.3016-08. Although, daily and weekly support levels underlined on the chart (zoomed in) should be considered.
That said, any failure in closing below the low end could reverse current direction sending USDCAD towards the high end of the zone. Further close above the high end may see the price pushing towards the vicinity of 1.3256-64. However, the weekly resistance area marked on the chart should stay in focus.
Having trouble with your trading strategy? Here’s the #1 Mistake That Traders Make
USD/CAD four hour PRICE CHART (Sep 24 – Nov 5, 2019)
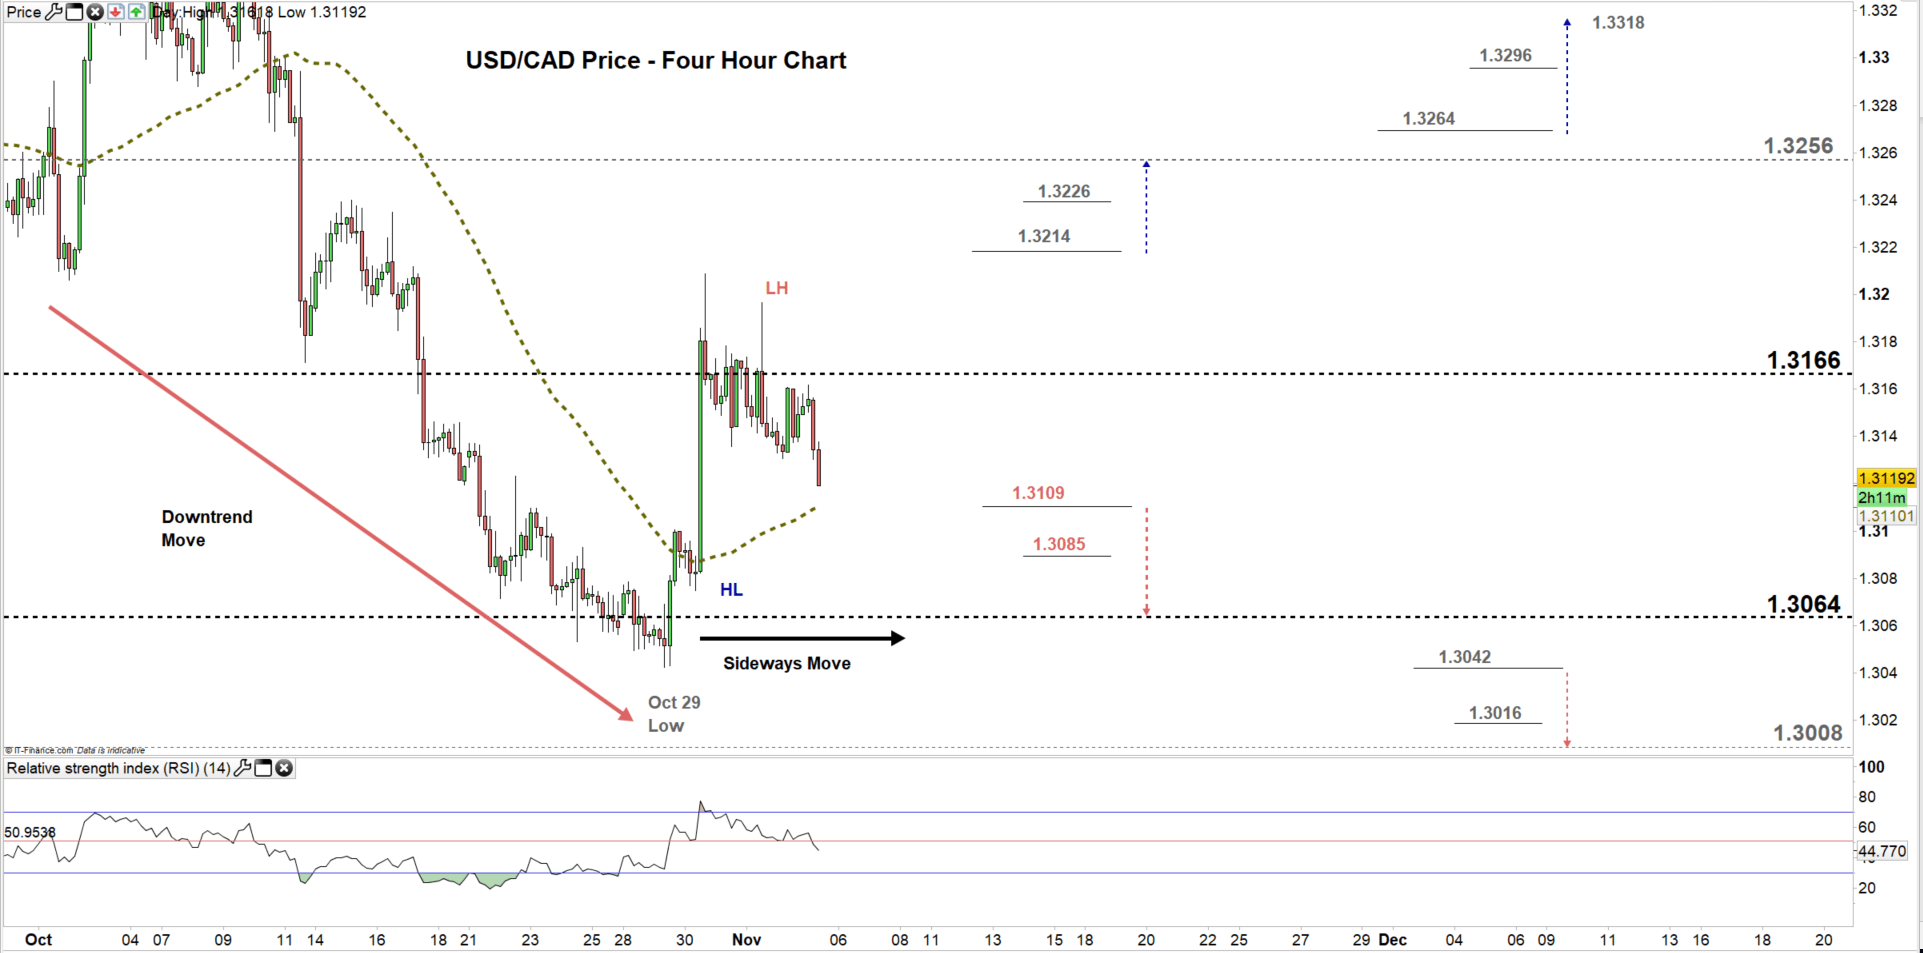
Looking at the four- hour chart, we notice on Oct 30 USD/CAD corrected higher creating a higher low at 1.3074 with sellers likely taking profits. However, buyers could not take advantage of this opportunity as the price created a on Nov 1 a lower high and stuck in a sideways move.
Hence, a break below 1.3109 could send USDCAD towards the low end of the aforementioned trading zone. Nevertheless, the daily support level underlined on the chart should be monitored. On the other side, if USDCAD breaks above 1.3214 this could lead the price towards 1.3256. In that scenario, the weekly resistance level underscored on the chart should be watched closely.
See the chart to know more about key levels to monitor in a further bullish/bearish move.
Written By: Mahmoud Alkudsi
Please feel free to contact me on Twitter: @Malkudsi