

US Dollar Technical Forecast
- US Dollar downside momentum is fading, will this translate into a reversal?
- USD/CAD turned higher on bullish technical signals, USD/JPY wedge held
- Negative RSI divergence hint that EUR/USD and GBP/USD may be topping
Not sure where the US Dollar is heading next? Check out ourfourth quarter fundamental and technical forecast!
US Dollar Technical Outlook
The US Dollar succumbed to selling pressure against its major counterparts this past week, but this may change in the days ahead. Using an equal average against EUR, GBP, JPY and AUD on the daily chart below, positive RSI divergence greets the Dollar’s descent. This is a sign of fading downside momentum and can at times precede a turn higher. Or, will the Dollar capitulate to further selling pressure?
Custom USD Index: Equal Average Versus EUR, GBP, JPY and AUD

Dollar Index Chart Created in TradingView
USD/CADTechnical Outlook
Where USD managed to get ahead was against the Canadian Dollar. Earlier in the week, USD/CAD formed a bullish reversal pattern (Morning Star) and swiftly turned higher thereafter – as expected. Prices then closed above the key resistance range between 1.3134 and 1.3145, ending the week around the latter. Further gains could be in store ahead, keep an eye on near-term resistance around 1.3226.
For timely updates on US Dollar price action, you may follow me on Twitter here @ddubrovskyFX
USD/CAD Daily Chart
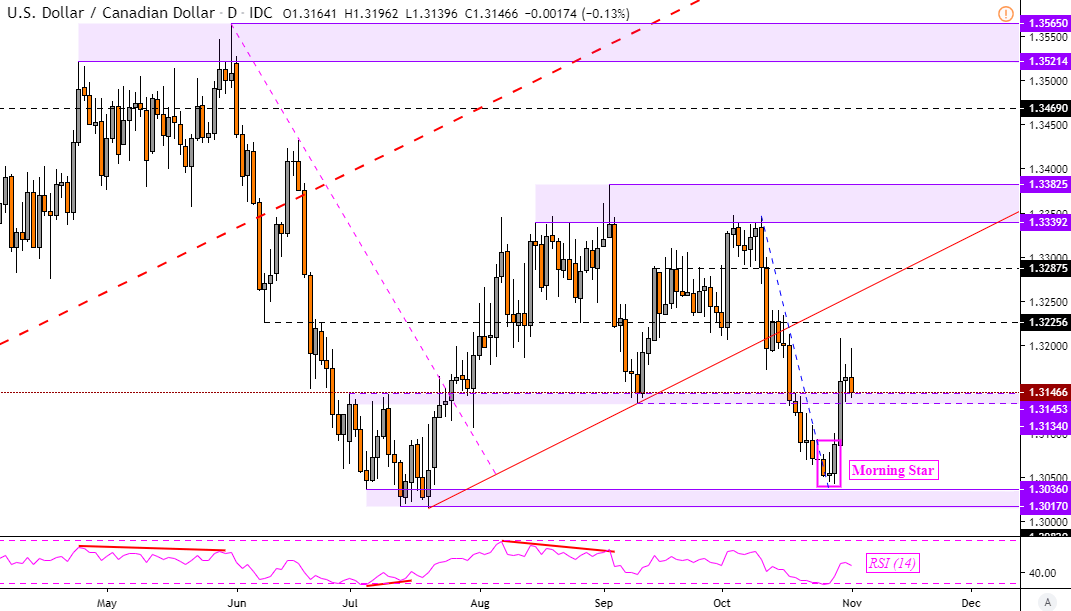
USD/CAD Chart Created in TradingView
EUR/USD Technical Outlook
Negative RSI divergence is accompanying recent gains in EUR/USD, hinting of fading upside momentum. Overturning the near-term uptrend from October involves taking out a rising support channel from the beginning of last month – blue lines on the chart below. Closing under 1.1076 exposes the September lows. Otherwise, climbing above 1.1182 opens the door to testing the next psychological barrier (1.1215 – 1.1250).
EUR/USD Daily Chart
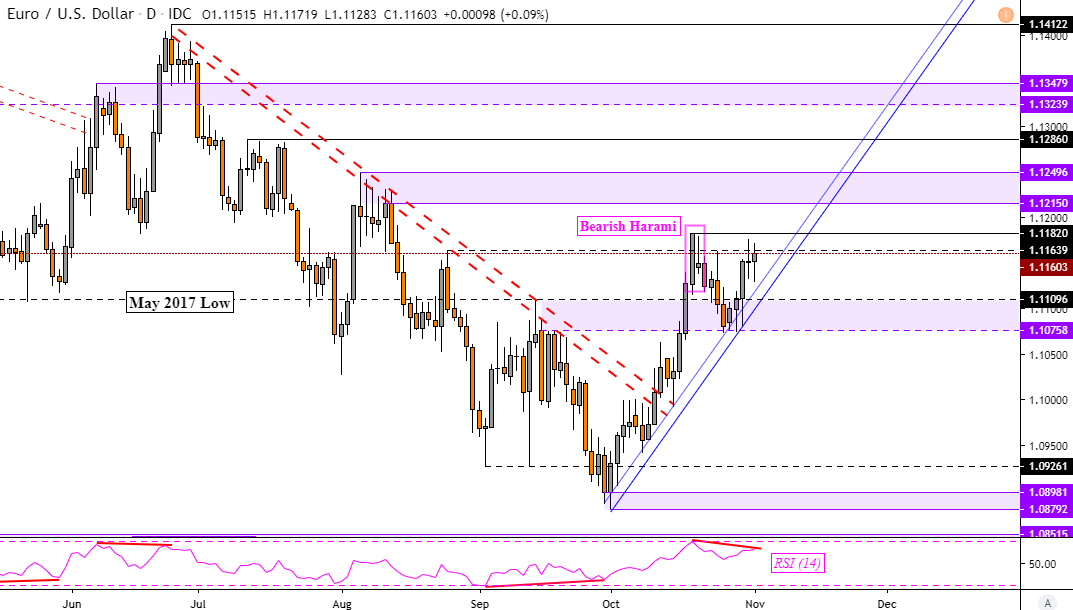
EUR/USD Chart Created in TradingView
USD/JPY Technical Outlook
Following negative RSI divergence in USD/JPY and a Spinning Top candlestick pattern, USD/JPY turned lower last week as it stuck to the boundaries of a Rising Wedge. This is typically a bearish reversal pattern, but prices have yet to breakout to the downside after the floor of the formation held. A daily close under risks overturning the dominant uptrend from August. Otherwise, key resistance to take out awaits at 109.32.
USD/JPY Daily Chart
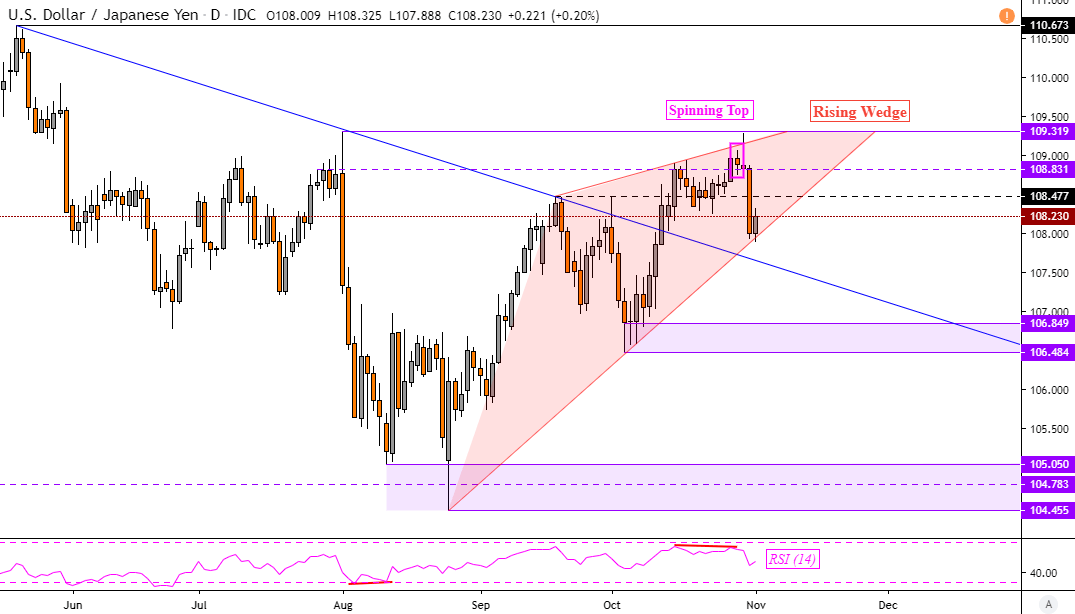
USD/JPY Chart Created in TradingView
GBP/USD Technical Outlook
Negative RSI divergence is also making itself well known in GBP/USD. While prices rose, the key horizontal range between 1.2950 and 1.3013 held. Meanwhile, near-term support was reinforced between 1.2773 to 1.2798. Depending which way the Pound pushes, if at all, may determine the fate of the uptrend that has been prevailing since September. Turning lower exposes 1.2582 while pushing higher puts the focus on 1.3177.
GBP/USD Daily Chart

GBP/USD Chart Created in TradingView
FX Trading Resources
- Having trouble with your strategy? Here’s the #1 mistake that traders make
- See how the Dollar is viewed by the trading community at the DailyFX Sentiment Page
- Just getting started? See our beginners’ guide for FX traders
--- Written by Daniel Dubrovsky, Currency Analyst for DailyFX.com
To contact Daniel, use the comments section below or @ddubrovskyFX on Twitter