

Crude Oil Highlights:
- WTI oil burst to two-month highs, to remain choppy though
- Brent is very near resistance, may stop short-term surge in its tracks
Check out the intermediate-term fundamental and technical outlook for major markets and currencies in the DailyFX Quarterly Forecasts.
WTI oil burst to two-month highs, to remain choppy though
Just the other day it looked like perhaps crude oil wanted to finally embark on a one-way track (lower), but just as that started to gain traction buyers showed up and reversed the course. Nothing new, really, which is why the other day I made mention that oil needed to change character for shorts to gain traction, that is have it drop (as it did to start the week) and not recover right away.
That is all behind us, so where are we now? The WTI contract is trading at two-month highs, but that could only be for a moment as another course reversal remains a high likelihood. A decline from here could quickly bring into play the lower part of the channel, an area we will again have to watch as support.
If the burst higher can sustain, though seemingly unlikely, and price can push through the upper parallel of the channel, then there isn’t strong resistance until the October 2018 and April trend-lines. An extended move into those lines feels like wishful thinking right now with how things have played out. Expect more whip-saws, but be on the watch-out for signs of sustainable momentum.
WTI Crude Oil Daily Chart (whip-saws inside channel)
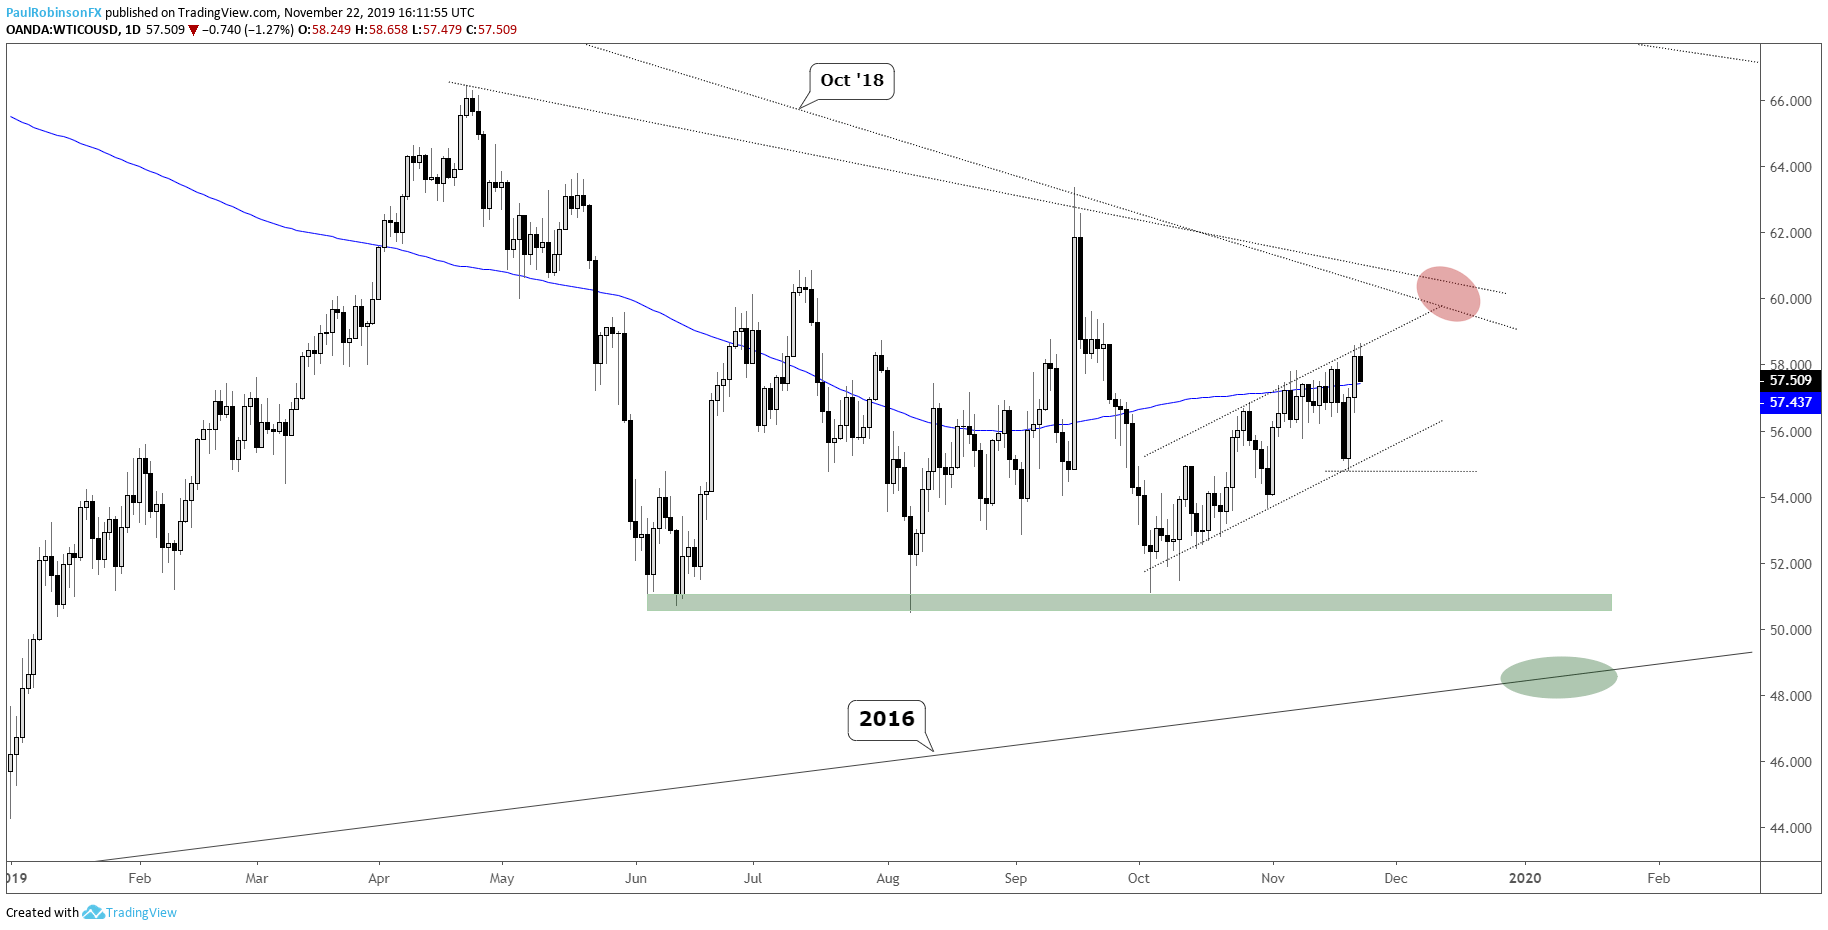
WTI Crude Oil Chart by TradingView
Trading Forecasts and Educational Guides for traders of all experience levels can be found on the DailyFX Trading Guides page.
Brent is very near resistance, may stop short-term surge in its tracks
Brent crude oil of course looks similar to its sibling contract across the pond, except conditions are even tighter. The trend-lines in place above for WTI loom right at hand for Brent, along with the 200-day MA passing through. Indeed, a thicket of resistance up to around 66 to clear.
A turn down here keeps the channel structure in place, with the lower parallel eyed as support. It will take a clean snapping of that pattern and decline beneath 60.43 to get oil moving south towards the 2016 trend-line.
Brent Crude Oil Daily Chart (stuck in channel, watch resistance dead ahead)
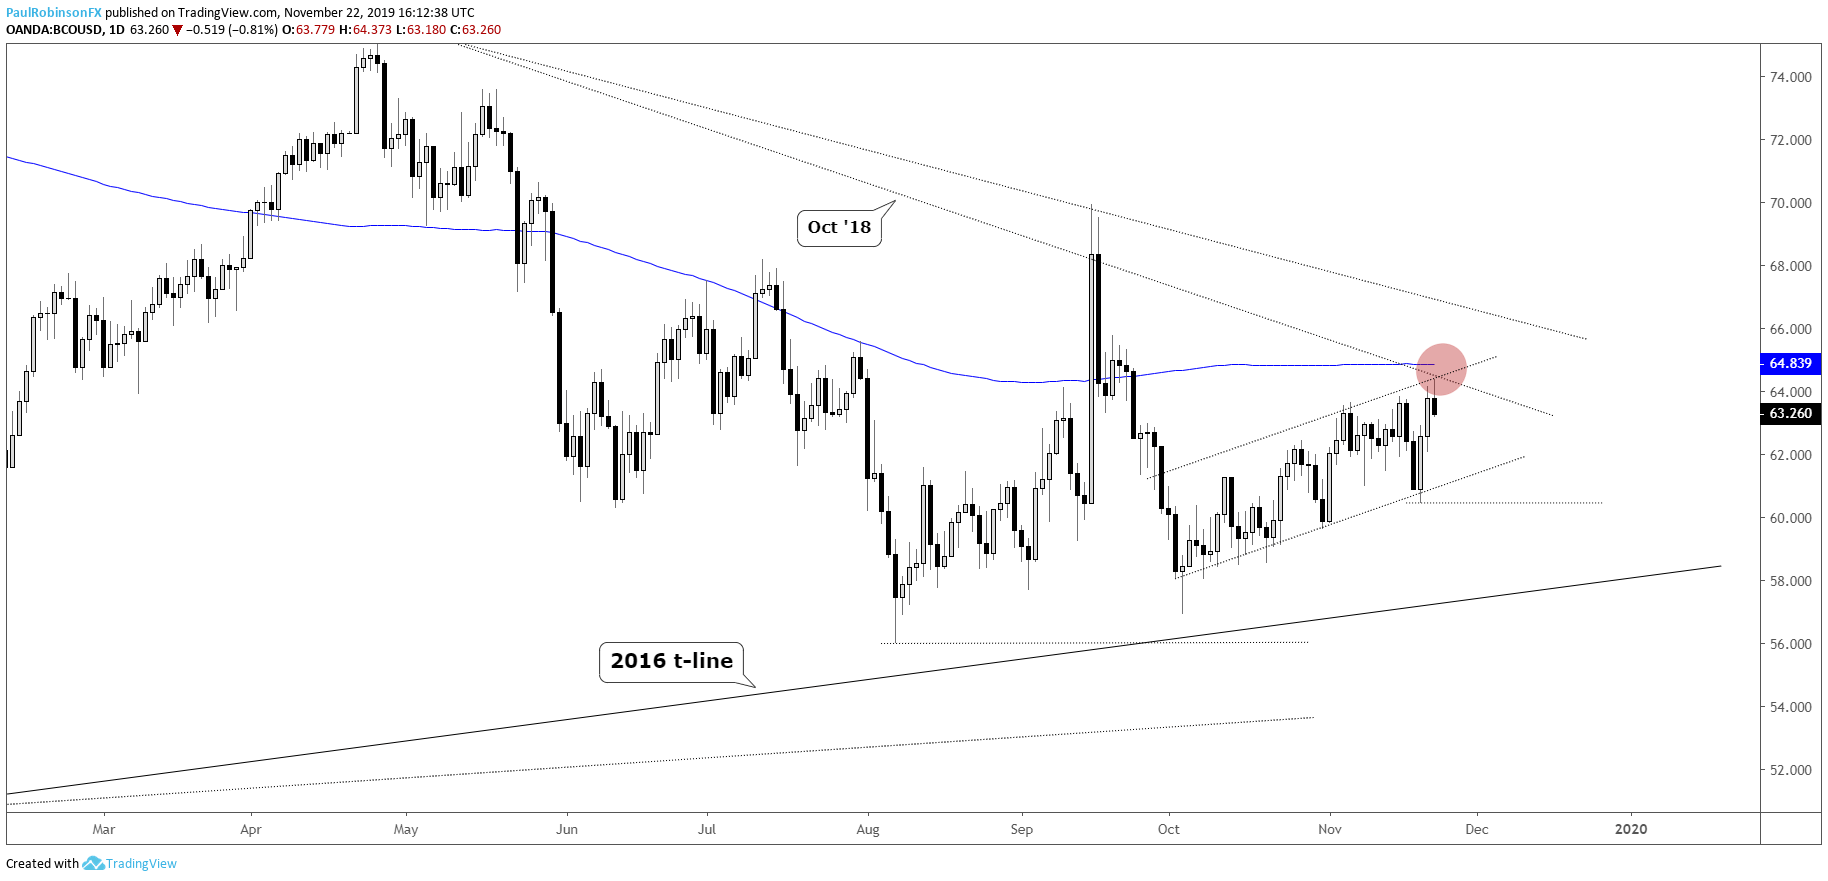
Brent Crude Oil Chart by TradingView
Forex & CFD Trader Resources
Whether you are a new or experienced trader, we have several resources available to help you; indicator for tracking trader sentiment, quarterly trading forecasts, analytical and educational webinars held daily, trading guides to help you improve trading performance, and one specifically for those who are new to forex.
---Written by Paul Robinson, Market Analyst
You can follow Paul on Twitter at@PaulRobinsonFX
https://www.tradingview.com/symbols/OANDA-WTICOUSD/